Download

1 / 11
110 likes | 325 Views
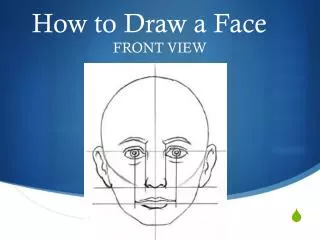
How To Draw. Map. PROFILES. From RegentsEarth.com. This topographic map shows a region of space (a field) as it would appear if you were directly above it. Your job is to convert this ‘above’ view into a side- ways view, a profile of the region from point A to point B.

E N D
How To Draw Map PROFILES From RegentsEarth.com
This topographic map shows a region of space (a field) as it would appear if you were directly above it. Your job is to convert this ‘above’ view into a side- ways view, a profile of the region from point A to point B. You will need a pencil and a ruler (or other straight edge). First: draw a line from point A to point B. At every point where line A-B crosses a contour line you will have to draw a line straight down to the corresponding line on the grid below.
Since you’re just starting out it may be helpful to make a small mark at each point where you will draw a line. This may prevent you from missing points. By counting these marks, there are 16 of them, you will know that you must draw 16 lines. Later you can check yourself to be sure you have drawn them all. The first mark you made was at point A. Notice that point A is on the 200m contour line. You must now draw a vertical line from point A to the 200m line on the grid below. The next mark is on the 300m contour line. Draw a vertical line from that mark to the 300m line on the grid below.
Now continue to draw straight, vertical lines from each mark to the appropriate line on the grid below. Using a pencil, connect the bottoms of the lines. Try to connect them with one smooth, curving line rather than a series of short, straight ones. Please notice that here the line went above 500m but well below 600m. That’s because this area of the map is above 500m but less than 600m. We know this because there is no 600m contour line here.
The same principle applies here. Your line must go below the 300m line and above the 200m line. That’s because if you were standing here you would be between the 200m and the 300m contour lines. And again, if you were here your altitude would be more than 600m but less than 800m (there is no 800m contour line on this map). Therefore you must be careful to make your line here go above 600m and below 800m. Make it OBVIOUS! Make your lines go in the middle between the grid lines so anyone scoring your profile will understand.
OK. Final check. You were supposed to draw 16 lines. Did you? Are the lines you drew straight, parallel and vertical? Are all the lines drawn to the proper grid line? Do your peaks and valleys go obviously between grid lines? Why bother checking? Because most students lose points not because they don’t know how to do this................. but because they’re SLOPPY! Good enough ISN’T good enough!
Here we have another contour map. Your job is to construct a profile along a straight line from points A to B. A slightly different situation: The problem is that the grid on which the profile is to be constructed is in the answer booklet on a completely different page. To make matters worse, the line A-B on this map is on a slant. What to do?
Using the contour interval below the map, carefully label each contour line crossed by line A-B with its elevation. STEP ONE 520 530 510 530 520 520 540 510 530 Make sure you don’t label this line........ It’s not a contour line. It’s Colden Creek. So we can check ourselves later, count how many lines are labeled starting with the 550 line at point B. You should have counted 10 lines. When we’re finished we can check to be sure we’ve drawn them all.
Place a blank piece of paper (here shaded blue) over the map just under line A-B. STEP TWO 520 530 510 530 Make a small mark on the paper by each contour line. 520 520 540 510 530 A 550 Now label each mark with the value of the contour line it represents. B and label A and B so you’ll know which end is which. Reminder: The number 533 is the maximum elevation of Aurora Hill and the triangle marks that spot. It is NOT a contour line and should be ignored.
This is the grid as it appears in the answer booklet provided with the regents. You are to construct your profile on this grid. STEP THREE Take the paper you marked with the contour line values and line it up below the grid so that the ‘A’ mark on the paper is below ‘A’ on the grid and the ‘B’ mark on the paper is below ‘B’ on the grid. Now, just as you did in the first example, take a straight edge and carefully make an X on the grid correspond- ing to each value on the paper below. The X for points A and B have been made for you.
STEP THREE Many students prefer to draw the lines but you do not have to. You can just put in the X’s Now connect the X’s using a single, smooth, curving line. Be sure your ‘peaks’ and ‘valleys’ go above and below grid lines just as in the first example. x x x x One last check. You were supposed to have marked 10 points on this grid. Are they all there? x x x x YES! Counting the points marked for you (A and B) there are 10 X’s. WELL DONE