Download
1 / 18
200 likes | 549 Views
Flooding in the UK 2007. Aims: To be able to explain why the floods of 2007 happened To be able to analyse the level of severity of the impacts. Key word. Starter: The picture show the weather at the time of the Summer 2007 floods.

E N D
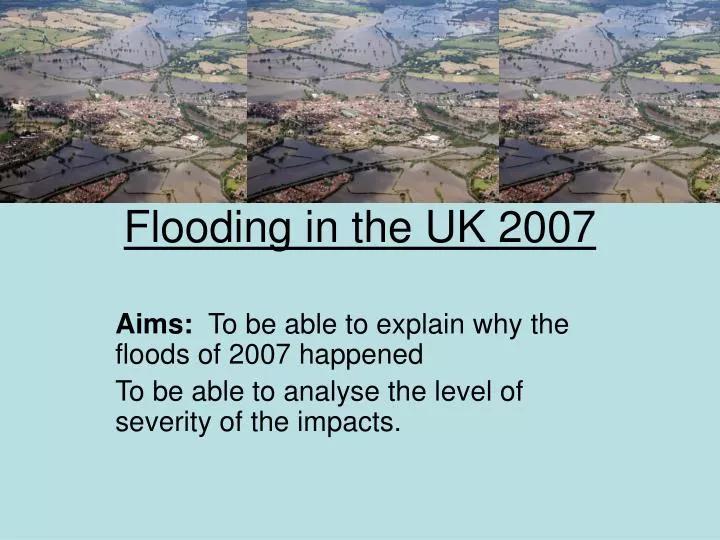
Flooding in the UK 2007 Aims: To be able to explain why the floods of 2007 happened To be able to analyse the level of severity of the impacts.
Key word Starter: The picture show the weather at the time of the Summer 2007 floods. What weather does the map show that would indicate a flood might occur?
Rainfall in central England in June and early July was much heavier than average in 2007. Some places saw rainfall almost every day for six weeks and the ground became saturated. A lot of this rain fell on built up areas.
On Monday 16th July, a large low pressure (rain is often associated with low pressure systems) got stuck over central and western England. • It rained heavily for four days. Friday 20th July was the worst day. 150 mm of rainfall was recorded in some areas, and amateur weather reporters recorded rainfall of up to 220mm. • Rainfall was less from Saturday 21 July.
Human • Use your diagram and try to put the causes of flooding into the correct sections of the diagram. Climatic Physical
Impacts of the flooding • Look at your 12 cards. • Read them through and choose the nine most significant impacts of the summer floods of 2007.
Complete a diamond nine with your chosen impacts. • How are you going to choose where each impact should go? • What makes an impact more or less significant? • Be ready to explain your ideas.
One end of the classroom represents false. The other end of the classroom represents true.
Flooding is always caused by too much rain. • (False: there are other causes of flooding.)
Flooding is worse when humans intervene. • (True: urbanization is a cause of flooding. False: human action can limit flooding.)
Once an area has flooded it will always be likely to flood again. • (Neither true nor false. The answer depends on the reasons for the flooding and identifying the flood likelihood in the future.)
Low pressure causes rainfall. • (True: when there is low pressure, air rises; as air rises it condenses; condensation results in precipitation.)
It can flood even in an area that hasn’t had any rain. • (True: dam failure, rapid snowmelt and downstream flooding can cause flooding without rain.)
The impacts of the summer floods were only short term. • (True: the water drained away quickly. False: it will take many people years to recover.)
Homework • There have been many floods in the UK throughout the 20th Century. • What criteria could we use to decide which were the worst?