Download
1 / 21
210 likes | 587 Views
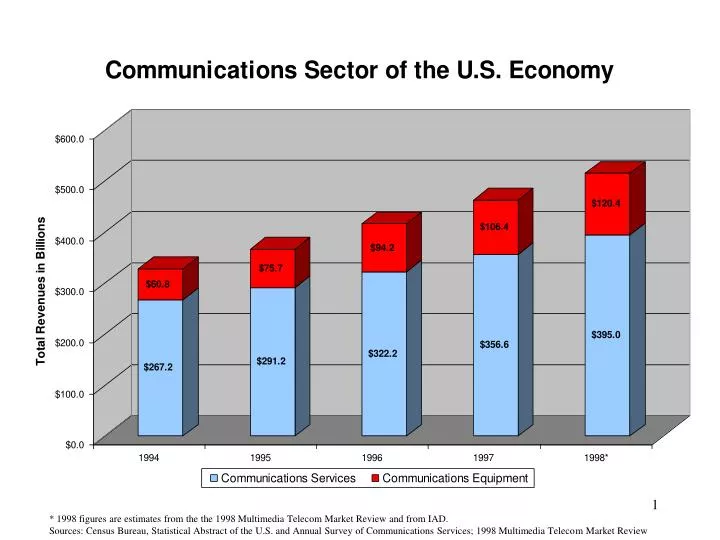
* 1998 figures are estimates from the the 1998 Multimedia Telecom Market Review and from IAD. Sources: Census Bureau, Statistical Abstract of the U.S. and Annual Survey of Communications Services; 1998 Multimedia Telecom Market Review .

E N D
* 1998 figures are estimates from the the 1998 Multimedia Telecom Market Review and from IAD. Sources: Census Bureau, Statistical Abstract of the U.S. and Annual Survey of Communications Services; 1998 Multimedia Telecom Market Review
* 1998 aggregate figure is an IAD estimate. Specific 1998 estimates for the different communications services segments were not available. Sources: IAD, Telecommunications Industry Revenue Report; Census Bureau, Annual Survey of Communications Services.
* As measured in average cents per conversation minute. LD consumer prices are based on all interstate and international calls. Access costs include all interstate and international access costs paid by IXCs to the LECs. Source: IAD, Telecommunications Industry Revenue Report. Prices shown are per conversation minute. Year-end 1998 data is not avail.
* Interstate & international calling as measured by all associated originating/terminating switched access minutes. Access costs as measured by the average cost per minute paid by IXCs to LECs for only the associated conversation minutes. Sources: Trends in Telephone Service and Telecommunications Industry Revenue Report. Full-year 1998 data is not yet avail.
* Refers to the carriers self-identified on their TRS filings as long distance service providers. Source: IAD, Trends in Telephone Service.
Average Rate per Minute* for an International Call 1994-1997 $0.91 $1.00 $0.84 $0.70 $0.80 $0.64 $0.60 $0.40 $0.20 $0.00 1994 1995 1996 1997 * Consumers can obtain even lower per minute rates under some rate plans Source: FCC Section 43.61 data (excluding reorigination and country direct and beyond). Full-year 1998 data is not yet available.
* 1998 figure is an ALTS estimate. Source: IAD, Local Competition Report. Local service competitors refer those identifying themselves as CAPs and/or CLECs on their TRS Worksheets submitted to the FCC.
* Refers to telephone-related complaints made by consumers. These complaints are typically related to carrier spamming/cramming practices, to faulty payphones and to problems with operator services. Source: CCB Enforcement Division
Note: 1992-1993 and 1997-1998 (1998 is an estimate) are end of year; 1994-1996 end in December. Sources: 1996 Competition Report, 1998 Competition Report, Paul Kagan Associates.
UP 380% From 16 Million Subscribers in 1993 UP 359% From $14 Billion as of 1993 DOWN 35% From $61.48 per Month in 1993 Charting the Growth in the Mobile Telephone Industry 1993 - 1998 60.8 Million Subscribers in 1998 113,111 Jobs in 1998 $50.2 Billion Invested as of 1998 UP 284% From 39,775 Jobs in 1993 Average Subscriber Bill Wait for Licenses Capital Investment DOWN 68% From 24 Months for Comparative Hearings Subscribers Jobs $39.88 Dollars Per Month in 1998 7.8 Months From Application to Grant Source: CTIA June 1998 Survey; FCC Report to Congress on Spectrum Auctions, September 30, 1997.
FCC’s Contract with Consumers • The Communications sector of our economy is rapidly growing and becoming more competitive every day. (ch. 1&2) • Our mission is to bring better services at better prices to every American. • For this mission to be successful, competition in all facets of the telecom industry must take root.
The Evidence: Long Distance Competition Goes the Distance • Long distance competition is robust: • Access costs/consumer prices are falling (ch. 3) • Spurring growth in long distance calling (ch. 4) • While the number of competitors grew by 77% between 1993 and 1997 (ch. 5) • Impact of competition is also being felt in International markets • per minute costs to consumers have declined each year since 1994 (ch. 6)
The Evidence: Local Competition is Hitting its Stride • Today, there are 10 times the number of competing local carriers (nearly 150) as there were pre-Telecom Act (source: ALTS) • Today, there are over 20 publicly-traded CLECs with a combined market value of $33 billion versus just 6 with a combined value of $1.3 billion pre-Act (source: ALTS) • Today, CLECs have 5.1 million access lines versus 800,000 pre-Act (source: ALTS)
The Evidence: Local Competition Continued • Revenues from competing carriers doubled to $3 billion in 1997 alone, and were estimated to have nearly doubled again to $5.7 billion in 1998 (ch. 7) • Since the Act, CLECs have raised almost $20 Billion from Wall Street versus just $3 billion pre-Act (source: ALTS)
Competition Reality Check • The emergence of competitive markets, however, does spur: • Consumer confusion over new choices • Consumer anxiety over fraudulent practices by new and existing carriers • …Leading to a rise in consumer complaints, which the FCC is tackling one by one. (see ch. 8)
The Evidence: Competition has Revolutionized Video,Wireless • Total MVPD subscribers have grown, with DBS and other alternatives capturing greater share of growth than cable (ch.9&10) • Wireless growth in past 5 years is dramatic as prices fall, subscribership is up and capital investment soars (ch. 11)
Looking to the Future: the Future is Now • Internet usage soared in 1998, driven by more consumers doing more shopping online. • The number of Internet shoppers during the holiday season grew 330% from the prior year’s holiday season. • Online spending during the holiday season almost tripled to $3 billion from the prior year’s holiday season.
Looking to the Future: The Future is Now • The transition to high speed Internet access is now a reality at affordable prices. Subscribership is expected to soar. (ch. 12) • Digital TV has begun rolling out, and prices already are falling for DTV sets. (ch. 13)