Download
1 / 24
280 likes | 602 Views
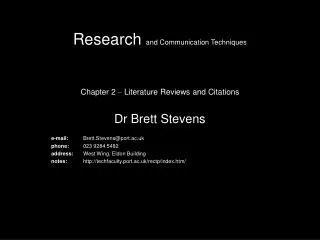
Research methods and techniques. . Perfecto Herrera. Aims of scientific research. Increasing and improving our understanding about the world All scientific disciplines proceed along these stages Describing Predicting Determining causes Explaining. Research approaches.

E N D
Research methods and techniques. Perfecto Herrera
Aims of scientific research Increasing and improving our understanding about the world All scientific disciplines proceed along these stages • Describing • Predicting • Determining causes • Explaining
Research approaches • Observational studies: we observe and code a given behaviour, then try to elaborate possible explanations (e.g., amount and duration of ocular contact between the members of a quartet) • We can develop hypotheses to be experimentally tested • We can develop co-influence (correlational) models • Correlational studies: we compare 2 variables the values of which have been collected without direct intervention (e.g. weekly hours of listening music with headphones and hearing acuity measured through audiometry) • We can just conclude on the concomitance or association between the variables. Never a causal relationship will be granted using this approach • Experimental studies: an “independent” variable is systematically manipulated and the effects of this on a “dependent” variable are observed. • With human listeners (e.g. effect of melody length on the recall of melodies) • With computer models (e.g. effect of analysis window length on the correct assignation of F0 values) • Only experimental studies grant to conclude on causal relationships.
The scientific method Hypothesis Theory Predictions Observations Hypothesis confirmation Hypothesis rejection
Steps in research • Search for an idea. They don’t come out of the blue! You have to do brain gym, observe, read, read, observe, think, read again... • It is usually the case that your topic, problem or idea has been previously worked or developed. Don’t reinvent the wheel! No inventes la sopa de ajo! • Talking and asking to other researchers and students can be crucial. Ask!
Do a search for relevant literature. Literature search is a must. • Once you have set the main ideas, google around and start building your conceptual map about the selected problem. • Take advantage of the resources to be found in the UPF Library. • Do not fall in love with your original idea (yet): be ready to reshape it a lot!
Talk to other people. If your idea can be understood by other people not working in the field, then you are on the right track. • People is useful to comment, critizize or transform your original idea. • If you have experts at hand they can finally assess on the references, constraints, required materials and devices, and other technicalities you should take into account.
Prepare an action plan. Organize the plan to get your goals and be able to write a report and do a public presentation of the work. • Take Hofstadter’s law very seriously. It states that it always takes longer than you expect, even if you take Hofstadter's Law into account. • Your supervisor will help you to set a realistic plan: ask him/her!!! Do not wait to be in a rush in order to ask for her/his help. The plan is a serious compromise between you both!!!
Run a pilot test. Don’t wait to get all the required data, all the code smoothly running and everything perfected. • It always happen that when you start your experiments something unexpected happens. • Minimize your risks by running some trials with a small amount of data, subjects or under simplified conditions. • Your closest friends and family are good candidates for you to get feedback from them and from the setup that you have devised. • Then, modify your original ideas and setup accordingly.
Design the study. You have to identify the independent and dependent variables, other factors to be controlled in order them not to confound the results. • How many subjects? Which “type” of subjects? What will be the instructions given to them? Which stimuli will be used? Which task will be asked to perform? Which devices will be required? • It is very useful to “copy” most of them from successful similar experiments to be found in the literature. • Before starting running the experiment, write down the questions you would like to answer when the data start to be arriving to your computer. • You can even start writing a report at this point, as you have reviewed literature, advancing hypotheses, designing the experiment and imagine possible outcomes.
Now “DO” the study. • A Pilot test is advisable before the real “GO!” • When you use subjects it is important to store demographical and some personal data that could be of relevance. But you should grant them the confidentiality of them (consent form). • When hearing is involved, it is also important to check that their audition is somehow in good shape.
Analyse your data. • Start with simple counts, averages, deviations, correlations • Plot, plot, plot. And ask yourself questions for the data to answer them • Then ask if more complex modelling would be feasible (e.g. Time Series, Discriminant Analysis, ANOVA, PCA…)
Explain data and possible conclusions to other people. • Are them clear or contradictory? • Do they point towards something you forgot to control? • Do them bring you towards more research, towards a different study? • Can you elaborate explanations for them? • Can you plot them in a way that they speak by themselves? Plot and plot, but also read Edward Tufte!!!
Write a report and prepare a public presentation. They should include the typical sections you find in articles: • Introduction • Method (including stimuli, materials, subjects, and procedure) • Results (including tables and graphs) • Discussion • Conclusions • Acknowledgements • References • Appendixes (optionally)
How to “measure” (music) perception and cognition? • Surveys (not an experimental procedure) • Behavioural measures • Physiological measures • Electro-Encephalography (EEG): • Event-Related Potentials (ERP) • Magneto-Electro-Encephalography (MEG): • Positron Emission Tomography (PET) • Functional Magnetic Resonance Imaging (fMRI)
Physiological measures • Heart rate • Skin conductance • Blood pressure • Temperature • Movement, activity
Behavioural measures • Errors solving a task • Reaction time (indicator of the availability and complexity of the processing operations in the brain (you can quickly estimate if 2 sounds have the same pitch or loudness (<150ms), but need more time to decide if they belong to the same instrument, genre or tonality) • Relatedness, similarity (5 or 7 point Likert-type scale) • Choice (forced, not forced, 2, 3, 4 choices) • Eye-fixation
Yes No
Event-Related potentials (ERP) When a sufficiently large number of neurons having a similar anatomical position and orientation are synchronously activated, their summed fields may be strong enough to be detectable as ERPs or ER Fields at the surface of the head.
Event-Related potentials (ERP) • An ERP is a neural signal that reflects coordinated activity of an ensemble of neurons • They often contain or signal combinations of effects • They have good temporal resolution so they can be observed “after” certain events or stimuli have been processed • Pxxx: positive peaks, Nxxx: negative peaks • MMN: Mismatch negativity occurring between 80 and 200ms after the event. It reflects the changes in the content of our auditory short-term memory (when something “new” is presented, a peak can be observed), even though we are not aware of that • N400 (200-500ms after the event) reflects semantic associations (the higher the association, the higher the potential value) • P600 (around 600ms) are observed after syntactic violations in language and also in music
Event Related Potentials (ERP) The same N400 is observed when the context is set using music and the words have no semantic relationship with it A semantic context is set either by speech (a) or by music (b) Hearing unrelated words generate a negativity peak in centro-parietal electrodes around 400ms But when there is a semantic relationship between the prime and the word, the negativity is not observed Koelsch et al. (2004). Music, language and meaning: brain signatures of semantic processing, Nature Neuroscience, 7(3).
Psychoacoustics Music Cognition Timings in the musical brain (according to ERP studies) Koelsch & Siebel (2005). Towards a neural basis of music perception, Trends in Cognitive Sciences Vol.9 No.12.
fMRI • fMRI detects changes in blood flow to particular areas of the brain, when performing a given task (e.g., it provides structural + “f”unctional information) • Magnetic resonance imaging (MRI) is based on the absorption and emission of energy in the radio frequency range of the electromagnetic spectrum • Oxygen nuclei have nuclear magnetic resonance, i.e., their spins act as small magnetic fields and can be aligned according to a magnetic field • Depending on the metabolism, the spins misalign and then this process can be “plotted” • Excellent spatial resolution, bad temporal resolution • It is totally uninvasive and innocuous Mental paper cut & fold puzzles Is there any brain listening to Beethoven? And to Mozart? And to Stockhausen? Beethoven’s Fur Elise) Mozart Sonata (K.448)
PET • It produces an image of the distribution of a previously administered radioactively labeled compound in any desired section of the body • A wide variety of compounds have been labeled permitting measurements of local blood flow, metabolism, neuro-receptor bindings... • Good spatial resolution, poor temporal resolution