Download

1 / 33
330 likes | 702 Views
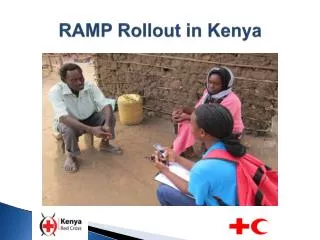
RAMP Rollout in Kenya. Rapid Mobile Phone-based survey (RAMP)in Kenya. Presented by Kioko Kiilu (KRCS) Jenny Cervinskas (IFRC) Nairobi, February 1 st , 2011. Outline. Introduction to Rapid Mobile Phone- based (RAMP) survey RAMP experience with KRCS volunteers

E N D
Rapid Mobile Phone-based survey (RAMP)in Kenya Presented by KiokoKiilu (KRCS) Jenny Cervinskas (IFRC) Nairobi, February 1st, 2011
Outline • Introduction to Rapid Mobile Phone-based (RAMP) survey • RAMP experience with KRCS volunteers • Site and project identification • Survey methods, training, fieldwork • Lessons learnt • Preliminary results • Plenary
RAMP: Purpose • To provide a survey methodology and operations protocol so that governments and NGOs can: • conduct health surveys at reduced cost • with limited external technical assistance • and achieve high standards of data quality • Dramatically decrease the time from data collection to having data available for decision making
RAMP survey tool: Features • Technical Reference Manual • Standardized questionnaires for malaria • Questionnaires designed on the internet using EpiSurveyor • Data collected using cell phones • Training manual and tools adaptable to local settings • Standard survey methods • Rapid analysis and reporting of results
The traditional data cycle Questionnaire Design Data Collection Weeks to Months (sometimes continuous) Data Entry Weeks to Months (sometimes continuous) Data Analysis Weeks to Months to Years Data Reporting Weeks to Months to Years ACTION Weeks to Months to Years (or never) Mobile technology can drastically reduce the time between data collection and action.
The SMT data cycle Questionnaire Design Data Collection • EpiSurveyor has: • eliminated the need for data entry and is now automating many analysis and reporting functions • shortened the time and reduced the costs between collection and action • Anyone can create a username and password at www.episurveyor.organd start using these tools for free Data Entry Data Analysis Data Reporting ACTION
Cell phone-enabled innovations • Questionnaire design in Episurveyor (internet) • Real-time data entry on cell phones • Daily upload of data from cell phone over 2G cell network to internet database • Real-time data cleaning • Real-time data analysis • Rapid production of preliminary survey results bulletin within 24 hours of last interview • Rapid production of preliminary feedback survey report in 72 hours
Aim is to simplify and improve the timeliness of the entire data collection cycle
RAMP experience with Kenya Red Cross Society (KRCS) volunteers
Site and project identification • Ongoing operational research project in malaria • Hard-to-reach areas/Long data cycle • Mobile network coverage • Project: Home Management of Malaria (HMM) in Malindi district, Coast province
Survey methods • 1st stage: standard probability-proportional-to-estimated-size (PPES) selection of PSUs • Sampling frame: 106 villages of the HMM project • 2nd stage: segmentation of PSU; choose 1 segment using PPES • SRS to choose 10 households • Precision: • +/- 6% for each key indicator from household questions • +/- 3% using roster/individual data • 30 PSUs, 10 households per PSU, 1500 persons, all ages
Three survey instruments • Household questionnaire • Usual household characteristics (wealth asset questions, distance to health facility, etc.) • Summary questions (innovation) • Duplicated nearly all key indicators that are in the person & net register • Eg., no. of persons: all ages & children <5 yo • No. of any nets, ITNs • No. of persons/children <5 yo slept under ITN last night • Person roster • Net roster • Number of persons that slept under each net
Recruitment and training • HMM volunteers (Interviewers) • HMM Coaches /MOH Public Health Officers (PHOs) (Supervisors) • Training – 4 days (January 19-22, 2011)
Training content & methodology • Content • Cellphone basics • Questionnaires • Informed consent • Interview techniques • Field procedures • Field logistics/reporting • Supervisor training • Methodology • Presentations, role play, group discussion, demonstrations, field tests (2)
Field work (January 24th-28th, 2011) • Survey teams: • 6 teams • 1 Team supervisor and 2-4 interviewers/team) • Survey supervisory team (KRC, IFRC, WHO, MOH, DataDyne): • Planning, logistic & financial responsibilities, field support, daily “quality” rounds, and remote monitoring of data quality
A day’s schedule • Morning briefing (“quality round”) • Meeting with community leaders, reviewing sketch maps, segmentation, selection of HHs • Conduct interviews at HH level • Supervisor will send data to server • Debriefing at day’s end with support team in Malindi • Data cleaning and analysis
Lessons learnt • Data entry: worked well, all teams were able to collect data using the cellphone and send to server • Survey conducted with reasonable adherence to correct field procedures • KRC volunteers were able to prepare the sketch maps, carry out segmentation, and apply SRS to select HHs • Preliminary results were available within 24 hrs. of the return of the last team from the field
Access: Two-thirds of ITNs to reach universal coverage are present. Gap is 32%.
Results: High percentage of ITNs are being used. Use gap is due to insufficient ownership of ITNs * 47% of nets had 3 or 4 persons sleeping under them
Age of ITNs * 88% of nets were LLINs
Treatment & diagnosis, <5 yo - Denominator for all indicators was % of children <5y with fever in the previous two weeks
Using the cellphones • No major problems: all cellphones were operational • No calls to the Datadyne “hotline” • Data entry: worked well • Data was sent to the server by all teams, every day • Daily/immediate upload of data if 2G/GPRS available • Potential difficulties: initial connection of cell phone to data network
So, does the RAMP “work”? • Conducted by secondary-school graduates with no previous survey experience • Survey was completed within two weeks • 1 week training, 4.5 days field work • Daily data cleaning accomplished • Preliminary survey results bulletin finished within 24 hours • Preliminary report finished within 72 hours • Provided excellent management information on the key indicators
Acknowledgements • Kenya Red Cross Volunteers • Kenya Ministry of Public Health and Sanitation • IFRC • Datadyne • WHO • Kenya Bureau of Statistics A special thanks to the survey team and the many families who agreed to be interviewed for this survey