Download
1 / 150
1.51k likes | 1.75k Views
Types physical kinds of green infrastructure resource v asset. ... improvements in quality of life and an improved green environment can increase ...

E N D
Slide 1:Green Infrastructure and the NW region. Martin Moss, Senior Specialist, Regional Advocacy and Partnerships Team
Slide 2:Purpose To give an overview on Green Infrastructure.
To outline what has been happening in the NW to date.
Slide 3:Structure. Origin
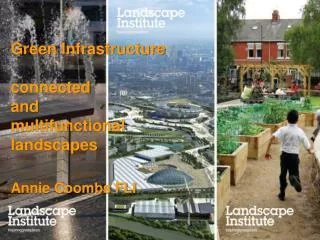
Overall concept
Underpinning concepts
Key drivers and agendas
NW Activity
The regional GI Guide
Progress with strategic planning
Some future issues
Natural England
Slide 4:Origin Originally a US concept.
Thames Gateway � Housing and Growth.
NW?
Community Forest succession.
Linking environment and regeneration.
Slide 5:Greening the Gateway. Issued in 2004
Seeks to protect and enhance the environment to:
Enhance quality of life of new and existing residents.
Support and protect biodiversity.
Create a positive image.
By creating a network of varied � greenspace � the setting for new and existing residential and commercial areas.
Landscape should be regarded as functional green infrastructure � delivers a range of benefits.
Slide 6:Gateway contexts. Sustainable communities.
Housing and economic growth in the SE.
Urban expansion.
Integrating greenspace networks into new development.
Protection and enhancement of existing assets.
Slide 7:Characteristics of Northern Growth. Regeneration and re-structuring of existing settlements � urban morphology change.
Major land restoration � tackling the industrial legacy.
Housing market renewal. Also improving the regional housing offer.
Public realm transformation.
Tacking population decline.
Boosting GVA � image, investment, economic productivity, new business sector development.
Slide 8:Concept Three components:
Purpose � what are we trying to achieve?
Definition � what are we talking about?
Approach � what are we actually doing about it?
Slide 9:Purpose The development of more sustainable and multi-functional urban and rural landscapes.
By:
Ensuring socio-economic activity brings spatially appropriate environmental benefits.
Developing natural environmental systems that contribute to providing for socio-economic needs.
A practical means to help deliver sustainable development.
Slide 10:Definition � Take your pick!! NW GI Guide.
The region�s life support system � The network of natural environmental components and green and blue spaces that lies within and between the North West�s cities, towns and villages which provides multiple social, economic and environmental benefits.
Natural England (Draft).
A strategically planned and delivered network comprising the boadest range of high quality greenspaces and other environmental features. Designed and managed as a multifunctional resource capable of delivering those ecological services and quality of life benefits required by the communities it serves and needed to underpin sustainability. Its design and management should also respect and enhance the character and distinctiveness of an area with regard to habitats and landscapes��.go to para 2
Slide 11:Approach The 5 steps �
Partnerships and priorities.
Data audit and mapping.
Functionality assessment � now, forces for change.
Needs assessment � spatial issues of key initial themes.
Intervention plan.
Slide 12:Aiming for? 4 things �
Creating new GI where needed - often retro-fitting of new GI into old places.
Change the function of existing GI to meet identified new needs.
Recognise what is already good and ensure it�s protection.
GI planned, delivered and maintained like other forms of infrastructure.
Slide 13:Where is Green Infrastructure?
Green infrastructure can be:
exposed or hidden.
It can exist in all land use contexts � its type, functionality and benefits will vary � reflecting the context within which it exists.
Slide 14:Types, functions and benefits. Types � physical kinds of green infrastructure � resource v asset.
Functions � something the GI is physically capable of doing/delivering.
Benefits � what is derived from functional GI � the outcome.
EG:
Slide 15:The Benefits Cycle.
Slide 16:Contexts v Types
Slide 17:Now you see it � now you don�t!
Slide 18:Green space v green infrastructure. What differentiates?
GI = Greenspace + environmental components in non-greenspace land use contexts.
GI = Benefits derived from functionality.
GI = more than a space � it�s a natural environmental system.
Greenspace (Resource/Asset) = GI but GI is not necessarily a space.
Slide 19:Green infrastructure penetration.This is the overall GI system coverage.
Slide 20:Versus - Naturalness and green space.This is the green space contribution.
Slide 21:Key Drivers � Strategic agendas Three key areas of policy development that have been driving thinking on green infrastructure.
Sustainable communities � driven by the growth agenda.
Ecosystems services � quest for integrated land, water and living resources management.
Natural economy � economic benefits of the natural environment.
Slide 22:NW Critical Agendas Last 3 years have been driven by 5 main agendas.
Economic regeneration.
Land regeneration.
Ecological frameworks.
Climate change.
Flood risk management.
Informed the development of activities in the region.
The growth and sustainable communities agenda growing.
Slide 23:NW activity � October 2007
Slide 24:Regional guidance. Purposes;
Communication.
Guidance on process.
Case study library.
Advice on policy.
A live document.
The further in the less well developed � develops as concept becomes applied at different scales.
Updates via website as experience grows.
Slide 25:Sub-Regional Strategy SREPs � Programmes and priorities - The Money people!
Natural Economy project � influencing and demonstration.
Building support for GI activities into Action Plans.
City Regions � Spatial policy and planning.
Pilot strategic GI planning for the NW.
Exploring how to go about strategic level planning.
Developing a clearer understanding of sub-regional and local policy needs.
Slide 26:Process of strategic assessment Lancashire
Engagement and priorities.
Baseline mapping of GI resource.
Strategic position of GI in the policy and strategy landscape.
Gap analysis � opportunities for investment.
Action planning.
Delivery.
Merseyside.
??????? Manchester
Agreement on key benefits.
Stage 1 � Data review and initial mapping. Bring together other work � Strategic Flood Risk Assessment, ASSCUE, Urban Ecological Framework.
Stage 2 � develop a strategic understanding � engagement � policy advice � next steps.
Stage 3 � Review stages 1 and 2 to agree on strategy development.
Slide 27:The future - LDFs � Core strategies � Action Plans � implementation.
Pilot strategic GI plans should develop firm advice on how to use the GI concept and approach in LDF processes.
ABIs � Masterplanning.
Begin to engage with ABIs (URCs, HMR etc) and explore detailed local application.
Slide 28:Natural England Policy. Inherited activities � Sustainable Communities Project and GI activities in the North.
Review experience and relevance of GI to Strategic Outcomes.
Developing policy:
An NE view of GI, definition and principles.
Expression in related policy documents:
Urban:
Housing and Growth:
????
Slide 29:Natural England activity. Currently embedded within the Sustainable Communities Major Project.
Engaged with Growth Areas, later Growth Points � embraced City Regional work in North (Expansion of Growth Agenda).
Supporting City Regional Strategic Planning.
Seeking to develop experience in ABI masterplanning for GI.
Engagement with �developers� to develop exemplar greenspace projects.
Period of transition � Expansion of Growth agenda � Developing NE view on GI.
Slide 30:Planned, delivered and maintained like other forms of infrastructure.
Slide 31:Regional Spatial Strategy & Emerging Green Infrastructure Issues Matt Ellis
Strategic Environmental Planning Officer
Slide 32:Presentation Outline
The regional growth agenda � emerging environmental issues
RSS policy framework
Green Infrastructure can help
links to spatial planning at the local level As part of this presentation I am going to start off by doing a bit of scene setting.
This will involve looking at the emerging regional growth agenda and some of the environmental impacts which may arise as a result.
I�m also going to outline how, following the EiP and the Panel recommended changes, the RSS policy framework attempts to address these.
I�m then going to spend some time looking at how Green Infrastructure (GI) addresses some of these issues and how it helps us deliver elements of sustainable development and the emerging RSS policy framework
Finally I�m going to look at how I feel GI and the spatial planning process can link together in identifying and delivering solutions.
Just a quick point though, as this is an Environment Agency presentation, it has a distinctly watery focus.
However, as I am sure you�ll be more than aware, there are other environmental issues arising from RSS beyond purely water management ones.
These include wider issues around biodiversity protection and enhancement, the impact of climate change on things like human comfort. The role of GI within these areas will be covered by other speakers later on in the workshop.
As part of this presentation I am going to start off by doing a bit of scene setting.
This will involve looking at the emerging regional growth agenda and some of the environmental impacts which may arise as a result.
I�m also going to outline how, following the EiP and the Panel recommended changes, the RSS policy framework attempts to address these.
I�m then going to spend some time looking at how Green Infrastructure (GI) addresses some of these issues and how it helps us deliver elements of sustainable development and the emerging RSS policy framework
Finally I�m going to look at how I feel GI and the spatial planning process can link together in identifying and delivering solutions.
Just a quick point though, as this is an Environment Agency presentation, it has a distinctly watery focus.
However, as I am sure you�ll be more than aware, there are other environmental issues arising from RSS beyond purely water management ones.
These include wider issues around biodiversity protection and enhancement, the impact of climate change on things like human comfort. The role of GI within these areas will be covered by other speakers later on in the workshop.
Slide 33:Going for growth and the regions environment Draft RSS = heavily economically driven
A step change in growth aspirations That RSS is an economically and growth driven strategy is hardly surprising given the history of decline and deprivation in areas of the NW, current government targets and a wish to capitalise on recent improvements in the regions economic performance.
Draft RSS is a step change in the regions growth aspirations, with proposed annual house building rates 79% higher than former RPG13.
At the RSS EiP discussions were had around the impact that this growth might have on the regions environmental and infrastructure capacity.
The important question arose �can this growth be achieved sustainably?�
Of specific relevance to the Environment Agency were issues around sustainable water management, particularly the impact of any proposed growth on flood risk, water quality/waste water treatment and associated infrastructure issues.
Also emerging were possible impacts on the regions valued species and habitats and landscapes.
This was all set against a backdrop of an increasing challenge faced by the region as a result of climate change.
The next few slides expand upon these flood risk and water quality issues.
That RSS is an economically and growth driven strategy is hardly surprising given the history of decline and deprivation in areas of the NW, current government targets and a wish to capitalise on recent improvements in the regions economic performance.
Draft RSS is a step change in the regions growth aspirations, with proposed annual house building rates 79% higher than former RPG13.
At the RSS EiP discussions were had around the impact that this growth might have on the regions environmental and infrastructure capacity.
The important question arose �can this growth be achieved sustainably?�
Of specific relevance to the Environment Agency were issues around sustainable water management, particularly the impact of any proposed growth on flood risk, water quality/waste water treatment and associated infrastructure issues.
Also emerging were possible impacts on the regions valued species and habitats and landscapes.
This was all set against a backdrop of an increasing challenge faced by the region as a result of climate change.
The next few slides expand upon these flood risk and water quality issues.
Slide 34:Growth and flood risk Firstly there are the obvious impacts arising from potential pressure to accommodate large amounts of new growth in existing areas of flood risk. For example, some of the districts with the highest proposed new housing numbers also have high numbers of properties in the flood plain and therefore high existing levels of flood risk . Firstly there are the obvious impacts arising from potential pressure to accommodate large amounts of new growth in existing areas of flood risk. For example, some of the districts with the highest proposed new housing numbers also have high numbers of properties in the flood plain and therefore high existing levels of flood risk .
Slide 35:Growth and flood risk There are also potential flood risk impacts of the runoff from the new development on downstream areas and the capacity of our surface and foul water drainage networks.
The more intense storms we expect to see as a result of climate change will further increase the challenge of managing our surface runoff.
As a result, surface water flooding may potentaily become more regular and widespread and we may expect to see increases in combined sewer discharges and, more unpleasantly,
CLICK
sewer flooding.
The floods in June and July of this year may give us an indication of what we might face in the future. For example, whilst many people were flooded from rivers, 5 times as many homes and businesses in places like Hull were flooded from overflowing drains and sewers.
There are also potential flood risk impacts of the runoff from the new development on downstream areas and the capacity of our surface and foul water drainage networks.
The more intense storms we expect to see as a result of climate change will further increase the challenge of managing our surface runoff.
As a result, surface water flooding may potentaily become more regular and widespread and we may expect to see increases in combined sewer discharges and, more unpleasantly,
CLICK
sewer flooding.
The floods in June and July of this year may give us an indication of what we might face in the future. For example, whilst many people were flooded from rivers, 5 times as many homes and businesses in places like Hull were flooded from overflowing drains and sewers.
Slide 36:Growth and water quality More growth, especially houses, leads to a greater demand for water.
The consumption of this additional water ultimately leads to increased volumes of sewage effluent to treat and dispose
The discharges from our sewage treatment works may have water quality impacts.
More growth, especially houses, leads to a greater demand for water.
The consumption of this additional water ultimately leads to increased volumes of sewage effluent to treat and dispose
The discharges from our sewage treatment works may have water quality impacts.
Slide 37:Growth and water quality the expected increase in intensive storm events as a result of climate change has a water quality as well as a flooding impact.
Increased pressure on foul sewer networks capacity can increase the frequency of CSO discharges
This means untreated sewage effluent can enter our water courses more often, with obvious water quality impacts.
the expected increase in intensive storm events as a result of climate change has a water quality as well as a flooding impact.
Increased pressure on foul sewer networks capacity can increase the frequency of CSO discharges
This means untreated sewage effluent can enter our water courses more often, with obvious water quality impacts.
Slide 38:Growth and water quality Increased development can also lead to more diffuse pollution,
This is as a result of construction activities themselves
and
CLICK
as a more general result of the often poor quality of urban runoff getting into our watercourses via surface drains and combined sewer systems.
Increased development can also lead to more diffuse pollution,
This is as a result of construction activities themselves
and
CLICK
as a more general result of the often poor quality of urban runoff getting into our watercourses via surface drains and combined sewer systems.
Slide 39:The emerging RSSpolicy framework � How does it respond? RSS growth = impacts on environmental and infrastructure capacity
Panel report changes = aimed at addressing these impacts and ensuring a more sustainable plan
Of particular relevance, policies DP1-DP8, W2, L4, EM1 and EM5 A significant number of the Panel�s recommended changes are aimed at ensuring RSS and its policies tackle the environmental arm of sustainability adequately.
At a high level the Panel�s recommended changes were aimed at embedding sustainable development issues into a new suite of spatial principles contained in policies DP1-DP8.
They also put a much increased emphasis on issues of infrastructure capacity. This revolved around the need to ensure development is located in areas of capacity or, where this is not possible, ensuring that it is timed to coincide with the delivery of any necessary new infrastructure.
In addition, draft RSS policy EM5 already contained a strong emphasis on requiring sustainable drainage in new development.
Their recommended changes also gave added weight to climate change adaptation, especially to the need to manage and adapt to increased storminess and resultant flood risk, habitat disturbance and pressure on water supply/drainage systems.
A significant number of the Panel�s recommended changes are aimed at ensuring RSS and its policies tackle the environmental arm of sustainability adequately.
At a high level the Panel�s recommended changes were aimed at embedding sustainable development issues into a new suite of spatial principles contained in policies DP1-DP8.
They also put a much increased emphasis on issues of infrastructure capacity. This revolved around the need to ensure development is located in areas of capacity or, where this is not possible, ensuring that it is timed to coincide with the delivery of any necessary new infrastructure.
In addition, draft RSS policy EM5 already contained a strong emphasis on requiring sustainable drainage in new development.
Their recommended changes also gave added weight to climate change adaptation, especially to the need to manage and adapt to increased storminess and resultant flood risk, habitat disturbance and pressure on water supply/drainage systems.
Slide 40:GI as a sustainable development delivery mechanism GI helps deliver:
Flood risk management
Improved water quality and maximised infrastructure capacity
And more�. GI has the ability to provide multiple functions which deliver beneficial environmental, social and economic goods and services.
I therefore believe it represents a solution to some of the key environmental issues and pressures arising from RSS growth.
Over the next few slides I am going to go through how I feel GI provides some of the solutions to address the flood risk and water management issues arising from RSS growth.
GI has the ability to provide multiple functions which deliver beneficial environmental, social and economic goods and services.
I therefore believe it represents a solution to some of the key environmental issues and pressures arising from RSS growth.
Over the next few slides I am going to go through how I feel GI provides some of the solutions to address the flood risk and water management issues arising from RSS growth.
Slide 41:GI and sustainable Drainage As mentioned before, draft RSS policy EM5 requires SUDS in all new development.
GI is a potential delivery mechanism for this element of RSS policy
To help explain this, I think it is useful to go back to basics.
This slide shows generalised urban and rural hydrographs.
As you can see the difference in drainage response is significant with less storage and greater runoff in urban catchments. This leads to much more flashy urban rivers with higher flood peaks which are reached in much shorter timescales.
SUDS have the potential to more closely mimic natural drainage characteristics, helping us better manage urban flood risk.
They can minimise the amount of surface water getting into our drainage systems helping maximise existing capacity to take additional surface and foul water flows. This can help minimise the risk of combined sewer overflows, surface and foul sewer flooding.
SUDS therefore have the potential to make our drainage systems more robust and better able to cope with the increased intensity rainfall events we expect to see as a result of climate change.
Additionally, there are the benefits of SUDS in improving the quality of runoff before it enters watercourses, vital in addressing the key issue of urban diffuse pollution.As mentioned before, draft RSS policy EM5 requires SUDS in all new development.
GI is a potential delivery mechanism for this element of RSS policy
To help explain this, I think it is useful to go back to basics.
This slide shows generalised urban and rural hydrographs.
As you can see the difference in drainage response is significant with less storage and greater runoff in urban catchments. This leads to much more flashy urban rivers with higher flood peaks which are reached in much shorter timescales.
SUDS have the potential to more closely mimic natural drainage characteristics, helping us better manage urban flood risk.
They can minimise the amount of surface water getting into our drainage systems helping maximise existing capacity to take additional surface and foul water flows. This can help minimise the risk of combined sewer overflows, surface and foul sewer flooding.
SUDS therefore have the potential to make our drainage systems more robust and better able to cope with the increased intensity rainfall events we expect to see as a result of climate change.
Additionally, there are the benefits of SUDS in improving the quality of runoff before it enters watercourses, vital in addressing the key issue of urban diffuse pollution.
Slide 42:So how does GI help? GI = Space for SUDS
It is the potential of green infrastructure to provide physical space to accommodate SUDS structures which is important here, especially if on plot SUDS controls are difficult to accommodate within increasingly high density developments.
For example site controls such as detention basins can be compatible with wider open space provision associated with developments.
Click
There are also those SUDS techniques associated with the transfer of surface water around sites, such as road side swales and French drains which can also be incorporated into any green infrastructure provision within developments.
Slide 43:So how does GI help? GI = Space for SUDS
Larger scale flood risk management opportunities There may also be larger scale opportunities for water storage attenuation solutions within existing or new public open space
These might be aimed at providing surface water or flood risk management on a wider sub-regional or catchment scale.
There may also be larger scale opportunities for water storage attenuation solutions within existing or new public open space
These might be aimed at providing surface water or flood risk management on a wider sub-regional or catchment scale.
Slide 44:So how does GI help? GI = Space for SUDS
Larger scale flood risk management opportunities
Maintenance and management also, if they are accommodated within managed public open space, this may help overcome some of the well known adoption and maintenance issues surrounding SUDS.
also, if they are accommodated within managed public open space, this may help overcome some of the well known adoption and maintenance issues surrounding SUDS.
Slide 45:So how does GI help? GI = Space for SUDS
Larger scale flood risk management opportunities
Maintenance and management
The multi-functionality of GI Whilst I�ve outlined some of the key benefits which GI can provide in water management terms, it is important to remember that sustainable water management functions are not the only ones GI provides.
Careful consideration should be given, especially through the design stages, to ensure functions such as recreational access, biodiversity protection and enhancement and wider climate change adaptation are also built in.
Whilst I�ve outlined some of the key benefits which GI can provide in water management terms, it is important to remember that sustainable water management functions are not the only ones GI provides.
Careful consideration should be given, especially through the design stages, to ensure functions such as recreational access, biodiversity protection and enhancement and wider climate change adaptation are also built in.
Slide 46:GI and the spatial planning system Sustainable development is the core principle underpinning planning
RSS Policy Framework
But what should planners do?
I hope that I have started to demonstrate how GI can deliverg sustainable development.
I therefore feel that GI sits well within the wider spatial planning system and has the potential to contribute to helping us deliver Sustainable Development, the core principle underpinning planning.
CLICK
Emerging RSS also has policy references within it to GI and I also hope I�ve started to demonstrate thi links between GI and the delivery of these and certain other RSS policy requirements.
But what should planners do at a local level?
Slide 47:Taking GI forward in spatial plans Address GI within LDF process by:
Understanding future GI needs
Ensuring delivery - Including policies promoting/requiring GI
When addressing this in spatial plans, I would already expect planners to be thinking about how to include policies in LDF core strategies
These would reflect the importance of green infrastructure, especially its links to delivering more sustainable water management, but also to climate change adaptation and its role in ecological protection and enhancement.
However, just as importantly, planners will need to gain an understanding of where there is a need to create new GI or ensuring existing GI provide additional social, economic or environmental functions.
The spatial planning system also has a role to play in ensuring this this is delivered.
Slide 48:Understanding future GI needs Identifying future needs:
PPS25 and SFRA�s
Looking first at how the spatial planning system itself can start to identify these future GI needs?
Firstly there is the strategic flood risk appraisal process as required by PPS25 and reinforced by RSS policy EM5.
There should be outputs of SFRA around fluvial and surface water flooding, its speed and depths and the impacts of flooding from developments elsewhere in a catchment etc.
SFRA�s should be able to provide guidance as to where certain locations would need SUDS, and also potentially the appropriateness of different techniques.
The SFRA process may also start to identify the potential need for large scale water storage solutions, even when this is outside of the individual authority itself.
Any such sub-regional control solutions would obviously need early consideration and identification within relevant spatial plans.
This information would start to point to geographic locations where it may be necessary to achieve additional flood risk management functions within new or existing GI.
Slide 49:Understanding future GI needs Identifying future needs:
PPS25 and SFRA�s
Identifying a 5 year supply of deliverable sites � early contact with United Utilities
Then there is the PPS3 requirement on LPA�s to identify a 5 year supply of deliverable sites
a lack of capacity to connect to a foul sewer could affect whether there is a reasonable prospect of the site being delivered in 5 years �
This therefore represents a key component of achievability and therefore deliverability as envisaged under PPS3.
There is also a stronger emphasis within emerging RSS around the need to ensure the location and timing of development is informed by water infrastructure capacity issues.
Linking up the site allocation process with United Utilities catchment planning and investment activities is essential in addressing this.
The early dialogue required by RSS policy EM5 will start to identify areas with sewer network capacity problems. In these specific locations there may be the possibility for GI to provide the necessary sustainable drainage functions which can help address these capacity issues and facilitate the delivery of sites.Then there is the PPS3 requirement on LPA�s to identify a 5 year supply of deliverable sites
a lack of capacity to connect to a foul sewer could affect whether there is a reasonable prospect of the site being delivered in 5 years �
This therefore represents a key component of achievability and therefore deliverability as envisaged under PPS3.
There is also a stronger emphasis within emerging RSS around the need to ensure the location and timing of development is informed by water infrastructure capacity issues.
Linking up the site allocation process with United Utilities catchment planning and investment activities is essential in addressing this.
The early dialogue required by RSS policy EM5 will start to identify areas with sewer network capacity problems. In these specific locations there may be the possibility for GI to provide the necessary sustainable drainage functions which can help address these capacity issues and facilitate the delivery of sites.
Slide 50:Planning for future GI needs Identifying future needs:
PPS25 and SFRA�s
Identifying a 5 year supply of deliverable sites � early contact with United Utilities
Ensuring delivery � policies in LDF�s
The processes I�ve just outlined may start to identify geographically specific requirements for sustainable drainage and water management functions within existing or even new GI.
As a result I would hope that planners would ask themselves if there was a need for any specific policies which set out GI requirements relating to certain site allocations, within certain specific area action plans or site specific SPD�s etc. The processes I�ve just outlined may start to identify geographically specific requirements for sustainable drainage and water management functions within existing or even new GI.
As a result I would hope that planners would ask themselves if there was a need for any specific policies which set out GI requirements relating to certain site allocations, within certain specific area action plans or site specific SPD�s etc.
Slide 51:The future?
I�ll leave you with this slide.
I�m not sure where it actually is, but I think it is a good representation of what could be achieved through the positive planning of our open spaces and green infrastructure, especially in an urban context.
Its not hard to imagine that such an area could provide a re-naturalised flood plain.
It would potentially reduce run off from adjacent development, helping manage urban diffuse pollution and reduce surface water and sewer flooding.
And, as you will hear later on, GI such as this has the potential to help address other sustainability issues like climate change adaptation by providing evaporative cooling and respite from the hotter temperatures as well as providing specific ecological protection and enhancements through the provision of habitats and habitat continuity.
It can also represent a high quality and visual resource and a possible route for more sustainable modes of movement.
One area of open space therefore has many functions and benefits which can be maximised through careful consideration and making links between various spatial planning activities.
As a result, GI represents a key sustainable development delivery mechanism for the region.
I hope that the rest of the day starts to add some more detail and clarification to some of these areas and gives you the opportunity to explore with others some of the issues you feel you�ll have to address when planning for GI.
Slide 52:Thank YouAny questions? Matt Ellis
Strategic Environmental Planning Officer
Slide 53:Sefton Green space strategy Steve Matthews
Local Planning Manager
Sefton Council
Slide 54:Sefton UDP Policy framework to require public greenspace
NPFA standards no longer acceptable!
But �
Open space study not complete
Slide 55:Policy approach Residential development � requirement for provision on site or enhancement nearby
Also �.
Commercial, industrial and leisure development �
but only
�where clear shortage of greenspace has been identified in a Council-approved greenspace strategy�
Slide 56:Open space study 734 urban greenspace sites
benefits � recreation, trees, visual, wildlife
However �
narrow approach
Slide 57:The green space approach
Change of direction �
Rise in profile of green space
CABE Space
Other authorities� experience � strategic approach > extra funding
Green infrastructure
Slide 58:Role of green space strategy Link to other strategies
Umbrella for recreation studies
Objectives of Sefton Borough Partnership
Corporate approach
Slide 60:Steering group
Wide representation � within and outside Council
�Green spaces� v �urban greenspace�
Different types of benefits � health, climate change, involving communities, regeneration
Slide 61:Developing standards 1 PPG 17 typology
Assess �
Quantity
Quality
Accessibility
+ variety
Slide 62:Developing standards 2 Quantity
Is there enough �? (too much? too little?)
� of each of the different types in PPG17?
Quality
Does it have the right kind of facilities?
Is it well maintained?
Slide 63:Developing standards 3 Accessibility � 2 key aspects
Parks and gardens
400 metres, 1km, 3km
Accessible natural green spaces � variation of Natural England model
400m - site of 20ha
2km - site of 20-100ha
Slide 65:Practical issues
Straight line v. actual distance
Distance to boundary or to entrance
Effect of barriers
What is �natural� green space?
Impact on extent of deficiency
Slide 66:Consultation
Parish councils
Community empowerment network
Network South
Focus groups
Area committees
Pitches - leagues and clubs
Youth advisors
After school clubs
Slide 67:Next steps Green space issues report
2 main documents:
- g�space & dev�t SPD � standards/ procedures
- corporate g�space strategy � action plan & priorities
Supporting both documents
- strategies for � play, open space, playing pitches, allotments
Slide 68:Green space strategy - opportunities clear priorities
link trees money to wider green space projects
widen scope of what is possible
- different partners & pots of funding, one-off funding
respond better to local needs � involving the community
Slide 71:What is Natural Economy Northwest? A three-year partnership programme that maximises the benefit from existing and new investment in the region�s natural environment - delivering RES Action 113.
A multi-agency/cross-sectoral partnership resourced by Natural England, the Northwest Regional Development Agency and the SITA Trust.
The Shared Vision � �A prosperous economic future with a thriving natural environment�.
Slide 73:NENW Programme Business Plan sets out several programmes of activity ranging from promotional and influencing activity, training work, engaging with selected demonstration projects to commissioning reports and providing technical support.
Two key strands of activity are the Natural Tourism Programme and the GI Programme-my focus from here on in.
Slide 74:NENW ORGANISATIONAL STUFF! Programme managed by Natural England using funds comprising the clever matching of a SITA Landfill programme with primarily NWDA funding ( with some from NE), which pays for the small staff team, on costs, plus limited budget for pump priming, technical support, monitoring and communications.
Formal governance is via a small Board representing the key partners.
Wider NENW Steering Group includes the key stakeholders- NWDA, NWRA, GONW, EnvAg, Forestry Comm., Community Forests and other NGOs, UU, Tourist Boards, Natural England��.
NENW GI Steering Group includes the above, and has two key roles a) to direct the GI Strand of the NENW prog and b) to enable increasing coordination between the agencies on GI in the Region.
The NENW Natural Tourism Steering Group provides a similar function for the NENW Natural Tourism Strand.
The NENW Staff are all seconded to the Programme.
Slide 75:What is Green Infrastructure? The region�s life support system; a network of natural environment components and green & blue spaces that lies within and between the Northwest�s cities, towns and villages, and which provides multiple social, economic and environmental benefits.
Slide 77:NENW GI Programme NB - NENW Formal start 15 Jan 2007
Ecotec Policy and Economic Benefits Reviews, & City Greens study,
Grey Infrastructure & Transport Corridors Review
Lancs GI Strategy
Work with the other 4 SRPs on Strategic Approach to GI (+ support via Reg GIU)
Strategic Funding Review
Advice for Natural Economy Projects re maximising econ benefits
Regional GI Synergy/Inter�agency Coordination
Selection of 6+ demonstration projects
Parallel activity on Natural Tourism
Slide 78:The Ecotec Report �The Economic Benefits of GI Currently being finalised
Been through many iterations, including extenal review by reps of the NWDA,NWRA, GONW & NENW steering Group
Based on a thorough literature review
Identifies 9 categories of economic benefit
Seeks to make the link to the NWDA�s Tasking Framework & the 2 types of SAV �ie what they have to deliver. For each category, encapsulates the benefits, sets out a model or diagram, and then summarises the evidence in a table, citing the references
Also summarises the context + links to key policies: eg RES, RSS, Sub-regional Econ Strategies, Sustainable Communities (DCLG), Ecosystem Services (DEFRA), Climate Change and the Sub-National Review
Slide 79:The Economic Benefits of GI
Flood alleviation and water management
Enhancing quality of place
Improved health and well being
Increased land and property prices
Creating a setting for inward investment
New opportunities for renewable energy production
Improving the tourism, recreation and leisure offer
New employment in land management and biodiversity.
Climate change alleviation
Slide 84:Flood alleviation and water management
Slide 85:Quality of Place
Slide 86:Improved Health and Well Being
Slide 87:Land and property prices
Slide 88:Creating a setting for inward investment
Slide 89:Renewable energy production
Slide 90:Tourism, recreation and leisure
Slide 91:Land management and biodiversity
Slide 92:Climate change alleviation
Slide 93:Whole landscape scale benefits of GI
Slide 94:Outstanding Issues Quantification and the contribution GI makes to GVA - how to compare the contribution investing in differing �bundles� of GI will make to closing the N/S GVA Gap as against other demands on economic development budgets?
Free riding - how to get all the benefiting agencies, & other beneficiaries (eg the private sector), to invest to secure �their� benefits?
Who pays to ensure the ongoing underlying ecosystem services - without which����??
Slide 95:The Economic Benefits of Investing in GI
Slide 96:
peter.wilmers@nwda.co.uk
www.naturaleconomynorthwest.co.uk
Slide 97:LIVERPOOL�S ECOLOGICAL FRAMEWORK Jane Hayward � Liverpool City Council
Slide 98:Presentation Overview Liverpool�s open space study and green infrastructure
Scope of the Space for Nature Study
Findings of the Phase 1 and 2 Habitat surveys
Objectives of the Ecological Framework and key findings
Achievements and long term benefits
Next Steps
Slide 99:Context � Liverpool Open Space Study Completed 2005
Identified a number of different open space typologies
Classified land into natural and semi-natural open space
Informed Space for Nature Study
Slide 100:Context - Liverpool�s Green Infrastructure Over 3000ha of open space
20% protected through designation as local wildlife sites
4 Local Nature Reserves
Mersey Estuary SPA/Ramsar site
Slide 101:Liverpool Space for Nature Study Why? � Up to date evidence base for LDF as required by national and regional policy
Who? Consultants (White Young Green)
Managed by EAS
Input from LCC Nature Conservation Officer and LWT
Slide 102:Liverpool Space for Nature Study Study divided into 3 stages:
Preliminary survey of all Liverpool�s green space to Phase 1 level and identify sites for further survey
Detailed botanical surveys on sites selected in Phase 1 and recommend sites for designation as Local Wildlife Sites
Ecological Framework � recommendations for biodiversity enhancement within the City
Slide 103:Phase 1 31 habitat types � grassland dominant followed by woodland
Connectivity between habitat patches across City reducing effects of fragmentation and providing opportunities for species migration
Slide 104:Phase 2 Detailed botanical surveys on selected sites
Applied Merseyside guidelines for selection of Local Wildlife Sites
Recommend sites qualifying as a Local Wildlife Site
Slide 105:Ecological Framework Local representation of the Biodiversity Resource and Opportunity Diagram in RSS
To identify:
Core Biodiversity Areas
Core Biodiversity Areas with potential to connect to one another
Deficiency areas
Slide 106:Liverpool�s Core Biodiversity Areas Identify Core Biodiversity Areas
Slide 107:Areas outside Core Biodiversity Areas Identify Areas outside CBAs that have the potential to improve the integrity of the CBAs and recommend actions for their enhancement
Identification of ecological buffer zones
Restricted to natural or semi-natural green space within 50m of CBAs
Enhancements focussed on NMBAP priorities
Slide 108:Example: Potentially suitable areas for buffers to aquatic CBAs
Slide 109:Core Biodiversity Areas with potential to connect to one another Identify existing natural and semi-natural green space that connects Core Biodiversity Areas (CBAs) to one another
Identification of direct links between CBAs separated by no more than 500m, OR
Identification of �stepping stones� separated by no more than 100m
Identification of existing corridors or linkages across a wider area, e.g. transport infrastructure
Recommend how green space connection among CBAs could be managed to support Biodiversity Action Plan targets
Slide 110:Example: Potential linkages between CBAs - North East Liverpool
Slide 111:Potential Linkages between Grassland CBAs
Slide 112:Deficiency Areas Identify areas of the City that are deficient in Core Biodiversity Areas (CBAs) by application of English Nature guidelines
Identify areas of green space within the deficiency areas that should be prioritised for habitat creation and enhancement
Identify areas deficient in both CBAs and natural and semi-natural green space, i.e. areas lacking the potential for enhancement
Make broad recommendations for habitat creation in these areas
Slide 113:Core Biodiversity and Semi-natural green space deficiency areas
Slide 114:Areas potentially suitable for enhancement within CBA deficiency areas Most appropriate habitats will usually be determined by site-specific factors.
Broad habitats which could contribute towards NMBAP priority habitats and species include:
Grassland
Woodland and Trees
Aquatic Habitats
Heathland
Scrub
Roundabouts
Green Roofs and Facades
Slide 115:Key Recommendations/ Findings Up to 700ha of green space has the potential to be enhanced to form a buffer for CBAs
Potential to create buffers benefiting woodland, aquatic, grassland and parkland habitats
Significant amount of green space in the City (over 2000ha) meets criteria for creating linkages between CBAs
Woodland CBAs not easily linked but consideration should be given to role of urban trees, small woodlands, hedgerows and railway lines connecting these sites
Slide 116:Key recommendations/ findings (continued) Targeted management of railway lines could provide significant benefits
Lack of CBAs and natural and semi-natural green space in and around the City Centre
726ha of semi-natural green space exists within deficiency areas which is suitable for ecological enhancement
The most appropriate habitats to create in deficiency areas are those targeted by or which contribute to NMBAP including ponds, reedbeds, urban trees and woodland, urban grassland and heathland
Novel urban landscape features such as roundabouts or green roofs may provide additional opportunities for habitat creation
Slide 117:Benefits of the Study The most thorough appraisal of Liverpool�s biodiversity to date
Up to date evidence base for the LDF
Fulfils RSS requirements
Recommendations will enable City Council to contribute to NMBAP targets
Recognises the ecological function of Liverpool�s green infrastructure and therefore contributes to wider green infrastructure objectives
Slide 118:Benefits of the Study Created a set of guidelines to enable consideration of biodiversity issues when drafting development plan documents which will in turn allow for :
Biodiversity to be integrated with wider social and economic priorities for the City
The protection of the most important biodiversity areas in the City
Green spaces outside the CBAs to be recognised for their contribution/ potential contribution to connecting and buffering sites and thus assist in preventing fragmentation and isolation of wildlife habitats
Inform the decision making process for development proposals
Assist in determining priorities for developer contributions for open space
Slide 119:Next Steps How will the framework be taken forward ?
Area Action Plans
Developer Contributions SPD
Technical Policies DPD
Land Allocations DPD
Link findings with those within open space study
Slide 120:Key Questions How to balance and integrate biodiversity with regeneration priorities?
The level of protection to be afforded to the Local Wildlife Sites
What level of protection should be afforded to buffers and green corridors?
What should the focus of biodiversity improvements be in the City?
Open space priorities for Liverpool
Slide 121:Conclusion Biodiversity enhancements must contribute to the regeneration of the City as well as contributing to the creation of a multifunctional green network within Liverpool
Slide 122:Further Information Jane Hayward �
0151 233 5654
jane.hayward@liverpool.gov.uk
Phase One Report available on our web site: www.liverpool.gov.uk/ldf (Evidence, Information and Monitoring
NVC surveys and Ecological Framework will be available once finalised.
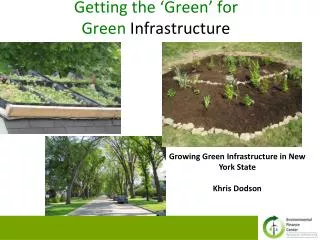
Slide 123:Green Infrastructure for Climate Change Adaptation- the role of spatial planning Dr Susannah Gill
susannahgill@merseyforest.org.uk
Slide 124:Climate change context Our climate is changing
Warming of the climate system is unequivocal
Coherent changes in many aspects of the climate system not just temperature
Changes go beyond natural variability
Temperature change in last 50 years is very likely (>90% chance) due to increase in anthropogenic greenhouse gas concentrations
IPCC (2007)
Slide 125:UK Climate Changes Average temp increases
High temp extremes increase in frequency
Low temp extremes decrease in frequency
Sea-surface temp warms
Thermal growing season lengthens
Winter precipitation increases
Winter precipitation intensity increases
Greater contrast between summer & winter
Snowfall decreases
Summer soil moisture decreases
Sea-level rises
UKCIP02 High Confidence Levels
Slide 126:Average Summer Maximum TemperatureScenarios for the North West
Slide 127:Average Summer Precipitation Scenarios for the North West
Slide 128:Average Winter Precipitation Scenarios for the North West
Slide 129:Climate Change Management
Slide 130:Mitigation � the role of GI Reducing greenhouse gas emissions and concentrations now impacts on the magnitude of future climate changes
Limited but important role of GI
Carbon sequestration & storage
Direct fossil fuel substitution
Material substitution
High quality landscapes near to where people live reducing, alternative routes to travel - reducing the need to travel by car Forests sequester and store carbon � biomass, soils, wood products
UK forests store as much carbon in biomass as we emit in one year
Forests cannot sequester all our carbon emissions
Land required, finite storage, natural events and long-term management issues, offsetting credits and verification
Need to reduce emissions at source
Contribution from substituting for fossil fuels directly (wood fuel) or indirectly (material substitution) more effective in long-termForests sequester and store carbon � biomass, soils, wood products
UK forests store as much carbon in biomass as we emit in one year
Forests cannot sequester all our carbon emissions
Land required, finite storage, natural events and long-term management issues, offsetting credits and verification
Need to reduce emissions at source
Contribution from substituting for fossil fuels directly (wood fuel) or indirectly (material substitution) more effective in long-term
Slide 131:Adaptation � the role of GI Changes over next 30-40 years already determined by historic emissions
Crucial role of GI
Moderating temperature extremes, especially in urban areas
Reducing volume and slowing rate of rainwater runoff
Flood management
Soil erosion
Providing wildlife corridors
Providing recreation spaces e.g. high capacity, less sensitive landscapes
Slide 133:Climate Change Impacts in the Built Environment Built environment is distinctive
High building mass and low greenspace cover leads to urban heat island
Surface sealing increases rate and volume of rainfall runoff
Climate change strengthens this distinctiveness
Urban greenspace helps to moderate these impacts
BUT climate change will also impact on functionality of urban greenspace
Slide 134:Greater Manchester UMT Map About 40% is farmland, remaining 60% is �urbanised� area
Residential areas just under half of �urbanised� area - �matrix�, dominant landscape category
Woodland covers 5% of the �urbanised� area, or 3% of Greater ManchesterAbout 40% is farmland, remaining 60% is �urbanised� area
Residential areas just under half of �urbanised� area - �matrix�, dominant landscape category
Woodland covers 5% of the �urbanised� area, or 3% of Greater Manchester
Slide 135:Evapotranspiring Surfaces
Slide 136:�Urban� Tree Cover
Slide 137:Maximum Surface Temperatures
Slide 138:Residential � 10% green cover
Slide 139:If grass does not evapotranspire� Maximum surface temperatures increase by
4.7-5.7�C in high density residential areas
13.8-15.6�C in schools
Slide 140:Occurrence of Drought for Grass
Slide 141:Adaptation in the Public Realm
Slide 142:Surface Runoff
Slide 143:Infiltration Capacity
Slide 144:Summary of Research Findings Greenspace moderates temperatures through evaporative cooling & shading
Mature trees critical for shading
Most effective in regulating surface runoff on high infiltration soils
Increase rainwater storage
Opportunity to use for irrigation in times of drought
Slide 145:The role of spatial planning GI planning has an important role to play in climate change (especially adaptation)
Functional importance of GI must be reflected in planning policy
Slide 146:All levels of spatial planning National � PPS
PPS1 supplement
Climate Change Adaptation by Design (TCPA, 2007)
Adapting to Climate Change � a checklist for development (GLA, 2005)
Guidance for Local Authorities on Implementing the Biodiversity Duty (Defra, 2007)
Regional � RSS
Local � LDF
Also important � Sub-Regional & non-planning documents
Slide 147:LDF GI Plan within LDF
Climate change mitigation and adaptation functions a crucial part of this
Developer contributions towards delivering GI Plan
Slide 148:GI Plan What is there and what functions is it providing?
Protect - Where it is critical environmental capital
Urban centres, flood plains, private gardens on high infiltration soils
Create - Where there is a need / functionality is lacking
High density residential and built up areas, low green space cover with human vulnerability
Enhance - Where management changes could improve functionality
Water storage capacity, wildlife corridors, SuDS
Maintain - So that it continues to provide that function
Overall green space cover, times of water stress
Slide 149:Example policies� Sheffield City Council proposed green roof policy
Required on all medium and larger developments (more than 15 dwellings / over 1000 m2 gross internal floor space)
Encouraged on all other developments
Must be compatible with other design and conservation considerations
Must cover at least 80% of the total roof area
Hull City Council proposing development control & policies to reduce flooding impact & flood-proof new development
Remove permitted development rights to control loss of private gardens
Lower development densities and higher green space & public open space requirements
Flood proofing built into any new development
Slide 150:Conclusion Our climate is changing
Need to mitigate and adapt
Mitigation role of GI limited but important
Adaptation role of GI substantial
Spatial planning has an important role to play in climate change adaptation
Planning policy must reflect the functional importance of GI at all levels
Need to know what we have and how it functions in order to protect, create, enhance, and maintain