Download
1 / 6
60 likes | 381 Views
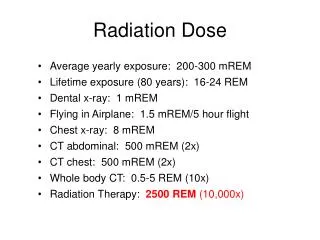
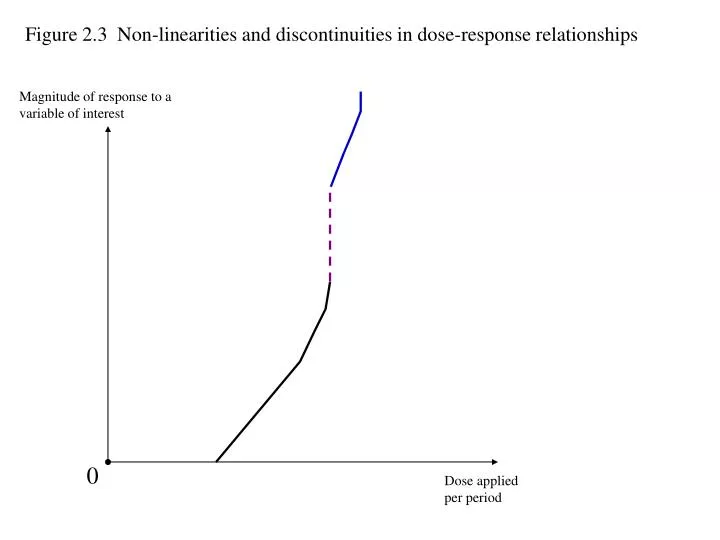
Figure 2.3 Non-linearities and discontinuities in dose-response relationships Magnitude of response to a variable of interest 0 Dose applied per period Figure 2.6 The theory of demographic transition Annual birth- and death-rates Birth rate Death rate 0 Stage 1 Stage 2 Stage 3 Stage 4

E N D
Figure 2.3 Non-linearities and discontinuities in dose-response relationships Magnitude of response to a variable of interest 0 Dose applied per period
Figure 2.6 The theory of demographic transition Annual birth- and death-rates Birth rate Death rate 0 Stage 1 Stage 2 Stage 3 Stage 4
Figure 2.7 The microeconomics of fertility £ Price of children MC P* MB 0 Number of children in family unit CH*
(a) e e = y y (b) e e = 0y - 1y2 y Figure 2.8 Environmental impact and income
Figure 2.11 Two possible shapes of the environmental Kuznets curve in the very long-run Environmental impact per income unit k b a 0 Y2 Y1 Y* Income
Case (a): Impact/Y 0 as t Environmental Impact Time, t Environmental Impact Case (b): Impact/Y k as t Time, t Figure 2.12 Two scenarios for the time profile of environmental impacts