Download
1 / 27
280 likes | 552 Views
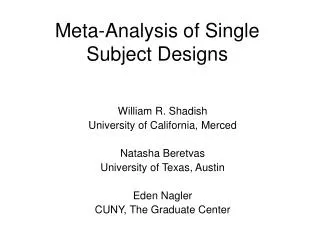
Effect Sizes for Meta-analysis of Single-Subject Designs. S. Natasha Beretvas University of Texas at Austin. Beretvas grant. Three studies: 1.a) Summarize practices used for meta-analyzing SSD results 1.b) Summarize methods used to calculate effect sizes (ESs) for SSD results

E N D
Effect Sizes for Meta-analysis of Single-Subject Designs S. Natasha Beretvas University of Texas at Austin
Beretvas grant • Three studies: • 1.a) Summarize practices used for meta-analyzing SSD results • 1.b) Summarize methods used to calculate effect sizes (ESs) for SSD results • 2. Simulation study evaluating performance of selection of ESs • 3. Conduct actual meta-analysis of school-based interventions for children with autism spectrum disorders.
Outline • Large-n designs’ data • Large-n Effect Sizes • Single-n designs’ data • Single-n Effect Sizes (sample) • Problems • 4-parameter model (AB designs) • Explanation • Continuing research
Large-n Studies’ Data • Most simply: consists of a randomly selected and assigned sample of participants in each of the Treatment and Control groups. • Each participant is measured once on the outcome. • Each participant provides an independently observed data point. • The standard deviation provides an estimate of the variability of these independent data points.
Large-n Effect Sizes • Provides a practical measure of the size and direction of a treatment’s effect. • In large-n studies, the standardized mean difference is most typically used: • Represents how different the two groups’ means are on the outcome of interest. • The “standardized” part originates in the difference being measured in standard deviations:
Single-n Studies’ Data • Most simply: repeated measures on an individual over time in two phases (time series data): • Baseline: phase A = “control” • Treatment: phase B = “treatment” • Score at time point t is related to score at time (t – 1): not independent.
Single-n Studies’ DataVisual Analysis: • Plots are evaluated for the presence of a treatment effect by simultaneously considering the following : • Sustainable level and/or trend changes • Baseline trends in expected direction • Overlapping data between phases • Variability changes within and across phases.
Single-n Effect Sizes • Seems reasonable that a standardized difference between scores in phase A and B could be used as an effect size (ES): • It seems feasible that this effect size would be on the same metric as for large-n designs?! • No!!
Problems with d for single-n designs • The standard deviation, s, for single-n designs describes different variability than for large-n designs. • If these were not problems, then it would also only make sense to use d when there is no trend in the data.
Trend in A and B phases, tx effect A single number cannot summarize changes in level and slope
Trend in A and B phases, no tx effect What would d indicate about this pattern?
Alternative single-n ESs • Percent Non-overlapping data (PND) is one of the most frequently used ES descriptors. • If treatment’s effect is anticipated to increase outcome then: • Horizontal line drawn through highest point in phase A through points in phase B • PND = % of phase B points above line • The higher the PND, the stronger the support for a treatment’s effect.
PND Baseline Treatment PND = 6/6 = 100%
PND Baseline Treatment PND = 11/13 = 84.6%
PND • PND is simple to calculate and interpret and takes into consideration: • Baseline variability • Slope changes, but
PND What would PND indicate about this pattern?
Alternative single-n ESs • Assuming linear trends, it seems that two ESs should be used to describe change in level and trend. • Huitema and McKean (2000) suggested using a four-parameter regression model (extension of piecewise reg’n suggested by Gorman and Allison, 1996). • Appropriate parameterization of this model provides two coefficients that can be used to describe change in intercept and in slope from phase to phase:
4-parameter model • The model: where Yt = outcome score at time t Tt= time point D = phase (A or B) n1 = # time points in phase A
4-parameter model – interpretation Coefficients represent the following: b0 = baseline intercept (i.e. Y at time = 0) b1 = baseline linear trend (slope over time) b2 = difference in intercept predicted from treatment phase data from that predicted for time = n1+1 from baseline phase data b3 = difference in slope • Thus b2 and b3 provide estimates of a treatment’s effect on level and on slope, respectively.
4-parameter model • Model can be estimated using OLS or autoregression (to correct SEs if residuals are autocorrelated). • The four-parameter model can be expanded for ABAB designs. • Multiple baseline designs can be thought of as multiple dependent, within-study AB designs. • b2 and b3 can be calculated for each individual and then summarized across individuals for a study.
4-parameter model • How does estimation of these coefficients function for differing true coefficient values? • How does an omnibus test work? • F-ratio testing addition of both predictors (with coefficients b2 and b3) • How to standardize regression coefficients for meta-analytic synthesis? • No procedure yet established for regular regression. • Comparison with long list of other SSD ESs.