Download
1 / 16
200 likes | 392 Views
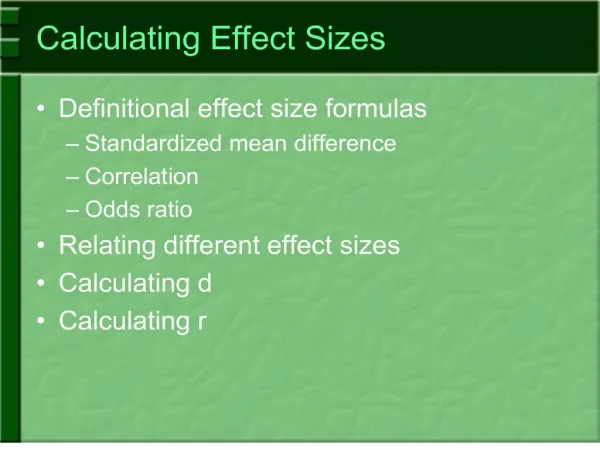
How to Calculate Effect Sizes for Meta-analysis in R. Load, Prep, and Check. library(ggplot2) library(metafor) #load the data marine <- read.csv("marine_meta_short.csv", na.strings=c("NA", ".", "")) #check variable types summary(marine). Load, Prep, and Check.

E N D
Load, Prep, and Check library(ggplot2) library(metafor) #load the data marine <- read.csv("marine_meta_short.csv", na.strings=c("NA", ".", "")) #check variable types summary(marine)
Load, Prep, and Check N_PolyN_Avg_MonoY_Avg_MonoSD_Avg_Mono LR VLR Min. : 2.000 Min. : 1.0 Min. : 0.001 Min. : 0.0005 Min. :-Inf Min. :0.000028 1st Qu.: 4.000 1st Qu.: 15.0 1st Qu.: 0.091 1st Qu.: 0.0518 1st Qu.: 0 1st Qu.:0.013405 Median : 5.000 Median : 16.0 Median : 1.785 Median : 0.8323 Median : 0 Median :0.045711 Mean : 6.328 Mean : 28.9 Mean : 104.299 Mean : 46.1341 Mean :-InfMean :0.144216 3rd Qu.: 6.000 3rd Qu.: 28.0 3rd Qu.: 17.463 3rd Qu.: 8.0472 3rd Qu.: 0 3rd Qu.:0.151159 Max. :32.000 Max. :256.0 Max. :3225.600 Max. :873.1538 Max. : 3 Max. :5.976395 NA's :5 NA's :5 NA's :6 Y_HedgesV_Hedges Min. :-3.2847 Min. :0.03516 1st Qu.:-0.1709 1st Qu.:0.23034 Median : 0.2469 Median :0.28101 Mean : 0.5169 Mean :0.31921 3rd Qu.: 0.8405 3rd Qu.:0.31712 Max. : 8.3140 Max. :2.32007 NA's :6 NA's :6
Calculating Effect Sizes by Hand #Log Ratio marine$LR <- log(marine$Y_Poly) – log(marine$Y_Avg_Mono) marine$VLR <- with(marine, { SD_Poly^2 / (N_Poly * Y_Poly^2) + SD_Avg_Mono^2 / (N_Avg_Mono * Y_Avg_Mono^2) })
Plotting #plot results ggplot(marine, aes(x=Entry, y=LR, ymin=LR-sqrt(VLR), ymax=LR+sqrt(VLR))) + geom_pointrange(size=1.4) + geom_hline(yintercept=0, color="red", lty=2, lwd=2)+ theme_bw(base_size=24)
Introducing escalc escalc {metafor} R Documentation Calculate Effect Sizes and Outcome Measures Description The function can be used to calculate various effect sizes or outcome measures (and the corresponding sampling variances) that are commonly used in meta-analyses. Usage escalc(measure, formula, ...) ## Default S3 method: escalc(measure, formula, ai, bi, ci, di, n1i, n2i, x1i, x2i, t1i, t2i, m1i, m2i, sd1i, sd2i, xi, mi, ri, ti, sdi, ni, data, slab, subset, add=1/2, to="only0", drop00=FALSE, vtype="LS", var.names=c("yi","vi"), append=TRUE, replace=TRUE, digits=4, ...)
Lots of Effect Size Measurements • "RR" for the log relative risk. • "OR" for the log odds ratio. • "RD" for the risk difference. • "AS" for the arcsine transformed risk difference (Ruecker et al., 2009). • "PETO" for the log odds ratio estimated with Peto's method (Yusuf et al., 1985). • "PBIT" for the probit transformed risk difference as an estimate of the standardized mean difference. • "OR2D" for transformed odds ratio as an estimate of the standardized mean difference. • "IRR" for the log incidence rate ratio. • "IRD" for the incidence rate difference. • "IRSD" for the square-root transformed incidence rate difference.
Lots of Effect Size Measurements • "MD" for the raw mean difference. • "SMD" for the standardized mean difference. • "SMDH" for the standardized mean difference without assuming equal population variances in the two groups (Bonett, 2008, 2009). • "ROM" for the log transformed ratio of means (Hedges et al., 1999). • "D2OR" for the transformed standardized mean difference as an estimate of the log odds ratio. …and many more
Using escalc hedges <- escalc(measure="SMD", data=marine, append=F, m1i = Y_Poly, n1i = N_Poly, sd1i = SD_Poly, m2i = Y_Avg_Mono, n2i = N_Avg_Mono, sd2i = SD_Avg_Mono)
Check your Errors! Warning message: In escalc.default(measure = "SMD", data = marine, append = F, m1i = Y_Poly, : Some yi and/or vi values equal to +-Inf. Recoded to NAs. >#what's wrong with row 18? marine[18,] … N_Poly N_Avg_Mono Y_Avg_Mono 7 42 NA
escalc Generates Funny Objects > class(hedges) [1] "escalc" "data.frame"
So, be Careful in Combining • Either use append=T and overwrite your data frame, or.. marine <- cbind(marine, as.data.frame(hedges))