Download
1 / 21
210 likes | 560 Views
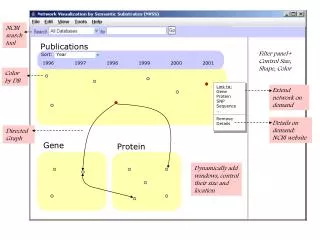
Review on expenses 1997 - 2001. Lund – London – Montreal – Marseille. Peter Platan. Definition of terms. These figures cover the time period of 1.9.1997 – 31.12.2001 with the exception of summer periods (June-August). However, London is included for June – August, 1999.

E N D
Review on expenses 1997 - 2001 Lund – London – Montreal – Marseille Peter Platan
Definition of terms • These figures cover the time period of 1.9.1997 – 31.12.2001 with the exception of summer periods (June-August). However, London is included for June – August, 1999. • The time period during which observations have been made includes 43 months in total. • All figures are in EUR and have been converted from local currencies. Exchange rates above. • Expenses have been classified in 9 categories: • Accommodation. Including rental expenses and all expenses related to accommodation such as electricity, water, telephone and heating expenses. • Food. Including all expenses for foodstuffs bought in e.g. supermarkets etc. • School. Including all expenses related to education such as books, copy fees, possible tuition etc. • Clothing. Including expenses for clothes. • Party. Relates to expenses for restaurants, night clubs, drinks, alcohol, entrance fees etc. • Sports. Expenses related to hobbies such as tennis, gym cards etc. • Lunch. Expenses from eating “out”. In other words, food bought and eaten in restaurants and cafeterias. • Travel. Travel expenses such as monthly bus cards, metro tickets, train tickets, airplane etc. • Other. Expenses not related to any of the categories mentioned above. Such as movie tickets, investments in fixed assets (e.g. kitchen utensils, stereo), postage expenses, gifts, extraordinary travel expenses (e.g. trips to Colombia, NYK, L.A, Caribbean), postage, dry cleaner etc.
Total expenses 1997 – 2001 45 000 38 572 eur 40 000 35 000 30 000 25 000 eur 20 000 15 000 10 000 5 000 0 Total expenses 1997 – 2001: 38,572 eur Total average monthly expenses 1997 - 2001 Total average per month 897,0 Other 215,4 Travel 56,9 Lunch 47,7 Sports 17,0 Party 99,4 Clothing 28,8 School 30,7 Food 99,1 Accommodation 302,2 0,0 100,0 200,0 300,0 400,0 500,0 600,0 700,0 800,0 900,0 1000,0 eur / mth
Summary of total expenses • Total expenses for the period of 1.9.1997 – 31.12.2001 accumulate to EUR 38,572. • Average monthly expenses for the time period amount to EUR 897,0 per month. • The largest expenditure item is accommodation (33,7%) followed by other (24,0%) and party (11,1%). • A more detailed analyses is provided on the following pages. • The cities of residence during the time period of 1.9.1997 – 31.12.2001 are: • Lund 09/97 – 05/98 • Lund 09/98 – 05/99 • London 06/99 – 08/99 • Montreal 09/99 – 05/00 • Lund 09/00 – 12/00 • Marseille 01/01 – 05/01 • Lund 09/01 – 12/01
Average pay-back time • The average monthly salary in Finland (year 2002) is approximately 2,220 eur. • Higher education should enable, on average, a 20% higher long-term monthly income. In other words, 444 eur higher income per month. • If the extra income is assumed to be utilised solely for the repayment of education expenses (here € 39,031) it would take 8,7 years to repay the total amount of education related expenses. Time value of money is accounted for (at 4% p.a). 40 000 33 943 35 000 29 050 30 000 24 345 25 000 19 822 Remaining outstanind expenses, eur 20 000 15 472 15 000 11 290 10 000 7 268 3 401 5 000 0 0 1 2 3 4 5 6 7 8 9 Years Average pay-back time of total expenses 8,7 years.
2 000 1 800 1 600 1 400 1 200 1 000 eur 800 600 400 200 0 09/97 11/97 01/98 03/98 05/98 10/98 12/98 02/99 04/99 06/99 08/99 10/99 12/99 02/00 04/00 09/00 11/00 01/01 03/01 05/01 10/01 12/01 Total expenses per month 1997 - 2001 Compounded monthly growth rate 0,4% • Total expenses for the period of 1.9.1997 – 31.12.2001 accumulate to EUR 38,572. • Average monthly expenditure for the period is EUR 897,0 per month.
Total expenses by category 1997 - 2001 14 000,0 12 993 12 000,0 10 000,0 9 261 8 000,0 eur 6 000,0 4 260 4 276 4 000,0 2 445 2 052 2 000,0 1 319 1 238 729 0,0 Accommod. Food School Clothing Party Sports Lunch Travel Other Total average monthly expenses by category 1997 - 2001 350,0 302 300,0 250,0 215 200,0 eur / mth 150,0 99 99 100,0 57 48 50,0 31 29 17 0,0 Accommod. Food School Clothing Party Sports Lunch Travel Other
Other 24 % Accommodation 35 % Travel 6 % Lunch 5 % Food Sports 11 % 2 % Party School Clothing 11 % 3 % 3 % Total average monthly expenses (%) by category Accommodation Other Food / Party
25 000 19 304 20 000 15 000 eur 11 071 10 000 4 760 5 000 3 437 0 Lund London Montreal Marseille Total expenses by city 50% 29% 12% 9%
1400 1230 1146 1200 Lund 09/97-05/98 Lund 09/98-05/99 952 1000 London 06/99-08/99 822 799 Montreal 09/99-05/00 759 800 eur / mth 644 Lund 09/00-12/00 600 Marseille 01/01-05/01 Lund 09/01-12/01 400 200 0 Average total monthly expenses by city and time period • Highest monthly expenses in Montreal (eur 1,230 per month) • Lowest monthly expenses in Lund during first term (eur 644 per month)
Lund 09/01-12/01 Lund 09/97-05/98 8 % 15 % Marseille 01/01-05/01 12 % Lund 09/99-05/99 Lund 09/00-12/00 19 % 9 % London 06/99-08/99 9 % Montreal 09/99-05/00 28 % Proportion of total expenses by city and time period
450 392 400 371 Lund 09/97-05/98 350 Lund 09/98-05/99 London 06/99-08/99 300 275 274 272 260 Montreal 09/99-05/00 243 250 eur / mth Lund 09/00-12/00 200 Marseille 01/01-05/01 Lund 09/01-12/01 150 100 50 0 Average monthly accommodation expenses by city • Highest monthly expenses in Montreal (eur 392 per month) • Lowest monthly expenses in Lund during second term (eur 243 per month)
140 124 122 120 Lund 09/97-05/98 111 104 100 Lund 09/98-05/99 100 London 06/99-08/99 Montreal 09/99-05/00 80 74 eur / mth Lund 09/00-12/00 59 60 Marseille 01/01-05/01 Lund 09/01-12/01 40 20 0 Average monthly food expenses by city • Highest monthly expenses in Lund during fifth term (eur 124 per month) • Lowest monthly expenses in London (eur 59 per month). However, proportion of food expenses category low in London as most food was eaten out (e.g. restaurants etc. and classified as lunch).
300 274 Lund 09/97-05/98 250 Lund 09/98-05/99 London 06/99-08/99 200 Montreal 09/99-05/00 eur / mth Lund 09/00-12/00 150 119 Marseille 01/01-05/01 96 Lund 09/01-12/01 87 100 77 75 72 50 0 Average monthly party expenses by city • Highest monthly expenses in London (eur 274 per month) !! • Lowest monthly expenses in Lund during first term (eur 243 per month) • No life in Lund during first term, too much in London in 3 months!
120 102 Lund 09/97-05/98 100 Lund 09/98-05/99 London 06/99-08/99 80 72 66 Montreal 09/99-05/00 eur / mth 58 Lund 09/00-12/00 60 Marseille 01/01-05/01 40 Lund 09/01-12/01 29 28 23 20 0 Average monthly lunch expenses by city • Highest monthly expenses in London (eur 102 per month) • Lowest monthly expenses in Lund during first term (eur 23 per month) • In line with food expenses as most of food was eaten out in London (eating out categorised as lunch expense).
Other 19 % Accommodation 36 % Travel 7 % Lunch 4 % Sports 2 % Party 11 % Food 15 % Clothing School 2 % 4 % Lund: Average expenditure pattern Accommodation Other Food
Other Accommodation. 19 % 24 % Travel 9 % Food 5 % School Lunch 0 % 9 % Clothing 8 % Sports 2 % Party 24 % London: Average expenditure pattern Accommodation / Party Other
Accommodation 32 % Other 36 % Food 6 % Travel 2 % School Lunch 5 % 5 % Sports Clothing Party 2 % 4 % 8 % Montreal: Average expenditure pattern Other Accommodation Party
Other 25 % Accommodation 39 % Travel 10 % Lunch 6 % Sports Food Party 0 % 11 % School Clothing 8 % 0 % 1 % Marseille: Average expenditure pattern Accommodation Other Food
Final Summary All figures in euros