Download
1 / 18
180 likes | 502 Views
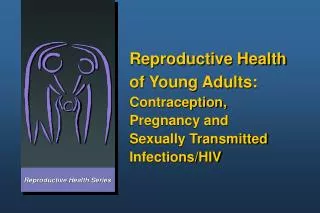
Reproductive Health Care for Women: Coverage, Access, and Financing. Usha R. Ranji, M.S. Principal Policy Analyst Kaiser Family Foundation KaiserEDU.org Tutorial December 2008. Figure 2. Prevention. Contraception Screenings Pap tests Breast exams Sexually transmitted infections.

E N D
Reproductive Health Care for Women: Coverage, Access, and Financing Usha R. Ranji, M.S. Principal Policy Analyst Kaiser Family Foundation KaiserEDU.org Tutorial December 2008
Figure 2 Prevention • Contraception • Screenings • Pap tests • Breast exams • Sexually transmitted infections
Figure 3 Contraception Allow women to prevent unintended pregnancies as well as plan and space their childbearing Typical U.S. woman who wants only 2 children must use contraceptives for roughly 3 decades 62% of women aged 15–44 currently use a contraceptive Most (64%) using reversible methods, such as oral contraceptives or condoms, but some differences between age and racial groups
Figure 4 Emergency Contraception • Prevents pregnancy after unprotected sex; does not affect established pregnancy • EC available over-the-counter for women 18 and older, younger women require a prescription • ~ One-third of women of reproductive age report that they did not know about EC • State policies can facilitate/limit access • Mandate referral/provision of EC to sexual assault survivors • Allow pharmacists to refuse dispense EC for moral or religious reasons
Figure 5 Contraceptive Coverage State Mandates for Contraceptive Coverage, 2008 • Some employer-based plans still not covering full range of contraceptives • No federal mandate requiring coverage • 27 states require coverage, but self-funded plans are exempt • Plans in states with mandates more likely to provide coverage Comprehensive mandate (8 states) Limited mandate* (19 states) None (23 states + DC) *Allows religious or ethical exemptions to the mandate. Source: Alan Guttmacher Institute, State Policies in Brief, May 2008.
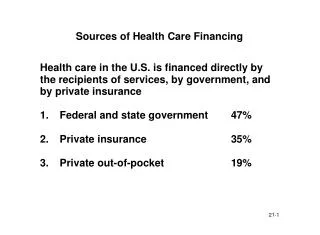
Figure 6 Medicaid and Family Planning Sources of Public Funding for Family Planning, 2006 • Enhanced federal matching rate • In 2006, 7.3 million women of reproductive age (15-44) relied on Medicaid for care • Pays for majority of publicly-funded family planning care • 26 states extend family planning services to low-income women not eligible for full Medicaid benefits Medicaid71% FederalGrants16% Other StateFunds13% Total= $1.8 Billion Note: Federal Grants includes Title X (11.7%), MCH Block Grant (2.1%), TANF and Social Service Block Grant (2.6%). Source: Sonfield, A. and Gold, R.B., Public Funding for Family Planning, Sterilization and Abortion Services, FY 1980–2006, AGI, 2008.
Figure 7 Title X Program Annual Title X Appropriation Levels ($ millions) • Publicly-financed network of clinics and providers for family planning services • Serves ~ 5 million low-income women annually • Funding levels have not kept up with inflation and demand 283 215 162 162 139 64 64 66 Sources: AGI, Fulfilling the Promise, 2000; NFPRHA, Title X Factsheet.
Figure 8 Sexually Transmitted Infections • At least 19 million new STIs annually; almost half among young people ages 18-24 • Racial/ethnic differences - Nearly half of young African-American women (48%) were infected with an STI, compared to 20% of young white women • Condoms effective in reducing transmission of STIs • HPV most common sexually transmitted virus • New vaccine prevents strains of HPV responsible for most cases of cervical cancer; recommended for girls and women ages 11-26 Source: Prevalence of Sexually Transmitted Infections and Bacterial Vaginosis among Female Adolescents in the United States: Data from the National Health and Nutritional Examination Survey (NHANES) 2003-2004
Figure 9 Women and HIV/AIDS Women as a Proportion of Newly Reported AIDS Cases, 1985-2006 • Proportion more than tripled since beginning of epidemic • Women of color, particularly African Americans, disproportionately affected • Young women at particular risk 27% 27% 20% 13% 8% 1985 1986 1990 2000 2006 Note: Includes reported cases among women 13 years of age and older. Source: CDC, HIV/AIDS Surveillance Reports, Vol. 18. 2008.
Figure 10 Teen Issues • Half (48%) of high school students have ever had sex • About one-quarter of teen females and 18% of teen males used no method of contraception at first intercourse • Rate of teen births much lower than in previous decades; very slight rise recently • National and state debates about content of sex education Live births per 1,000 women ages 15 to 19: Sources: CDC National Youth Risk Behavior Survey, 2007. Hamilton BE, Martin JA & Ventura SJ. Births: Preliminary data for 2006. CDC National Vital Statistics Reports, 56(7). 2007.; Martin JA, Hamilton BE et al. Births: Final data for 2005. CDC National Vital Statistics Reports, 56(6). 2007.
Figure 11 PregnancyandMaternityCare
Figure 12 Pregnancy and Childbirth Distribution of hospital stays for women, 18-44, 2000 • 4.1 million births annually • C-section rates rising – accounted for 31% of live births in 2006 • Many new technologies available • Complications in 1/3 of births • - 13% births pre-term • - Higher rate of maternal mortality among African American women Nonobstetric-related 40% Obstetric-related60% Source: Estimates based on AHRQ, Care of Women in U.S. Hospitals, 2000: HCUP Fact Book No. 3, September 2002.
Figure 13 Figure 3 Paying for Maternity Care Average expenditures for maternity care, 2004 • ESI plans cover all pregnancy-related care, including prenatal care, childbirth and delivery, and post-partum care • Individual insurance plans often do not cover maternity care • Medicaid covers 41% of births - higher eligibility threshold for pregnant women than for other adults • Costs can be unaffordable for uninsured women $10,958 $7,737 Vaginal Delivery C-Section Delivery Source: March of Dimes, Cost of Maternity and Infant Care, 2007.
Figure 14 Trends in Abortion Abortion Rates Among Women, Ages 15-44, 1980-2005 Abortions per 1,000 women • Half of unintended pregnancies end in abortion • Overall rate declining, but not among low-income women • 9 out of 10 abortions occur within first trimester • 74% are self-pay 30 29.3 25 20 19.4 15 10 5 0 1980 1984 1988 1992 1996 2000 2004 Source: Jones RK, et al. 2008. Abortion in the United States: Incidence and Access to Services, 2005, Perspectives on Sexual and Reproductive Health.
Figure 15 Access and Financing Abortion Services • Federal Policy • Hyde Amendment bans Federal financing of abortions except in cases of rape, incest, or to save the life of the woman. Impacts: • Medicaid • Women in military, federal employees & dependents, Native Americans covered by Indian Health Services, Women with disabilities covered by Medicare • “Partial birth” abortion ban – passed by Congress and signed into law by President Bush in 2003, upheld by Supreme Court in Gonzales vs. Carhart in 2007 • State Policy • Waiting periods (24 states) • Provider/Facility Regulations (30 states) • Parental consent/notification for minors (35 states) • Health care provider refusal clauses
Figure 16 Infertility Services Number (in thousands) of ART Cycles at Reporting Clinics, 1996-2005 • Broader range of treatments now available • Use of ARTs estimated to have nearly doubled between 1996 and 2002 • Costs $12,000 on average per IVF cycle • Relatively limited insurance coverage; 15 states mandate at least limited coverage for diagnosis and treatment Source: CDC, 2005 Assisted Reproductive Technology Report.
Figure 17 Conclusions • Range of reproductive health services has expanded tremendously • Access is central to women’s overall health and well-being • Federal and state policies wield significant influence on reproductive health • Likely to continue to be at center of several policy debates
Figure 18 Related Resources • Kaiser Family Foundation Women’s Health Policy http://www.kff.org/womenshealth/index.cfm • Guttmacher Institute: http://www.guttmacher.org/ • Sexuality Information and Education Council of the United States: http://www.siecus.org/ • Reproductive Health Technologies Project: http://www.rhtp.org/ • National Family Planning and Reproductive Health Association: http://www.rhtp.org/ • Association of Reproductive Health Professionals: http://www.arhp.org/ • Childbirth Connection: http://www.childbirthconnection.org/