Download
1 / 5
50 likes | 63 Views
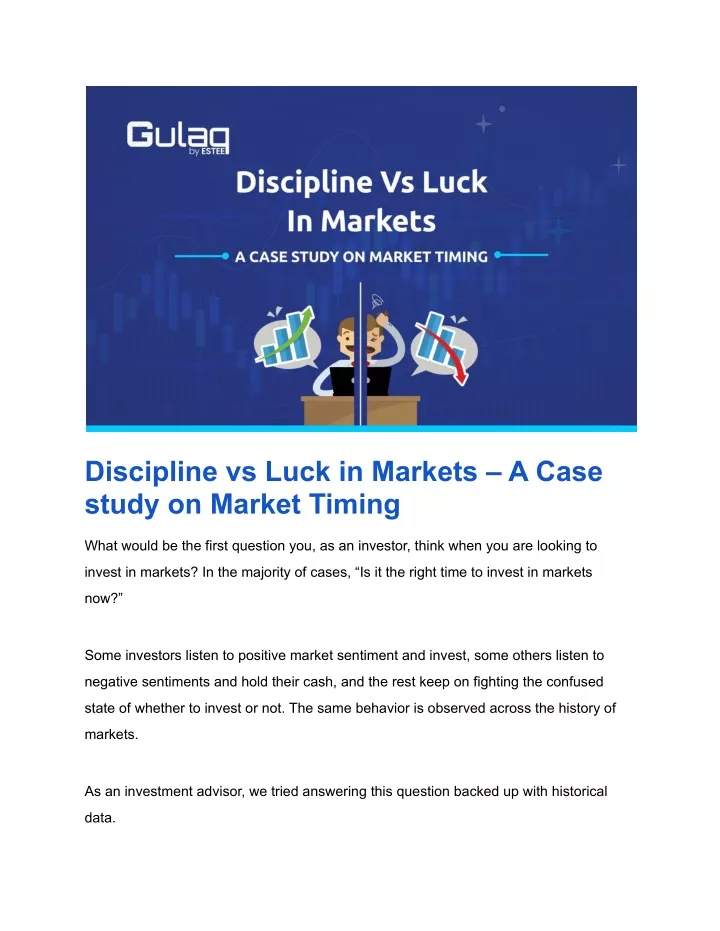
Some investors listen to positive market sentiment and invest, some others listen to negative sentiments and hold their cash, and the rest keep on fighting the confused state whether to invest or not. The same behaviour is observed across the history of markets.

E N D
Discipline vs Luck in Markets – A Case study on Market Timing What would be the first question you, as an investor, think when you are looking to invest in markets? In the majority of cases, “Is it the right time to invest in markets now?” Some investors listen to positive market sentiment and invest, some others listen to negative sentiments and hold their cash, and the rest keep on fighting the confused state of whether to invest or not. The same behavior is observed across the history of markets. As an investment advisor, we tried answering this question backed up with historical data.
At Gulaq, our stance is that market timing is more important than timing the markets. So, we did a case study on the past 32 years of market data to validate our stance. We considered four types of investors: Mr Disciplined, Mr Lucky, and Mr Unlucky Mr Disciplined – Do not track markets actively. He invests on the first of every month irrespective of market sentiments. Mr Lucky – As the name suggests, He tried to time the markets and has picked the bottom of every month. Mr Unlucky – Unlike Mr Lucky, this guy is so bad at market timing that he ended up picking the worst prices every month. Mr FD – Feels markets are risky. So, he invested in a fixed deposit at 7% interest rate. These investors invested Rs. 10,000 every month for the past 32 years. The exact time period we considered is from 1990 to 2022. Intuitively speaking, Mr Lucky would be the one with highest returns and biggest portfolio. The interesting part to look at would be the difference between Mr Lucky and Mr Disciplined, and the other one would be Mr Unlucky and Mr FD. We asked our team to guess the difference between Mr Lucky and Mr Disciplined before the analysis. Our team guessed it to be around 50%. If someone can predict the bottom every month for 32 years, surely his portfolio should be multiple times that of someone who just invests on the 1st of every month. After all, we hear so much about compounding.
We were surprised looking at the actual portfolios and even re-ran our analysis to cross-check everything. Mr Lucky = 2.48 Crores Mr Disciplined = 2.34 Crores Mr Unlucky = 2.2 Crores Mr Lucky is better off by just 6% compared to Mr Disciplined. We are constantly being told to catch the market's bottom to aggregate wealth quickly. The data says it really doesn’t matter. The case study is clearly saying the power of compounding takes care of market timing over the long-term. Easier said, than done. We are living in a world, where everything which affects markets goes round and round in a matter of a few minutes. In that case, will the investors have the patience to stay invested for 30+ years? Hence, we did a similar case study across different time periods to see the impact of market timing. Because investing for the long-term is subjective. Some might consider 5 years as long-term investing, and others might consider 30 years. As this case study is primarily concerned about discipline vs luck, we limited our follow-up simulation to only Mr Lucky and Mr Disciplined. We ran this analysis on 5 Years, 10 Years, 15 years, 20 Years, and 25 years’ time periods starting from 1996. The results are shown in the below table.
If we consider the shortest time period – 5 years – the maximum difference stands at 13%, and the minimum is at a meager 7%. Similarly, over a period of 25 years it was 11%. Since we were focusing on the luckiest cases, let’s stick to the 13% difference case. That is getting 2.47% edge per annum, but with close to zero probability. Would it make sense to worry about your investments for the unrealistic additional 2.47% returns per annum? We would love to see you investing time in your personal life and stay disciplined rather than constantly worrying to chase Mr Lucky for the extra 1-2% returns annually. This case study helped us understand the true meaning of compounding. The power of compounding takes care of market timing over the long term. Better be disciplined than chase luck for years.
That’s why when investors ask us about our views of the markets, and whether they are undervalued or overvalued we always give them the same standard and boring reply that we don’t know, and it really doesn’t matter. Note: From 1990 to 2022, Mr FD invested in FD at a 7% interest rate. His SIP of Rs 10,000 every month ended up at Rs 1.44 crores as of Sep 2022. Mr Unlucky, despite being so terrible at timing his investments, had 52% higher returns compared to Mr FD.


![Careers in [discipline]](https://cdn3.slideserve.com/5819956/careers-in-discipline-dt.jpg)