Download

1 / 5
50 likes | 121 Views
At Instart Logic, we created an eCommerce ROI calculator to help organizations determine the potential revenue gains from undertaking a performance optimization project.

E N D
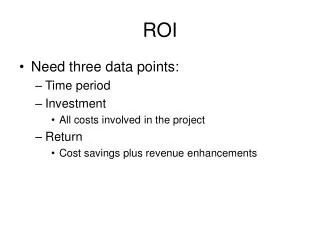
I recently purchased a home that needs quite a bit of updating. While there are some things like painting that my husband and I are capable of doing, we weren’t sure if it was worth it. We looked at the cost of buying all the materials and the amount of time it would take us to complete the project. In the end, we decided the return on investment (ROI) wasn’t worth it and it could be done faster if somebody else did the work. We hired a general contractor to coordinate and hire professionals to do the work. The one exception is the yard. Although it was tempting to rent goats to remove 20 years of plant growth, I am doing that myself. Others in this situation may have chosen differently. That’s the thing with ROI – there is a different answer for everybody. • ROI statistics are frequently quoted to prove how important performance is to the bottom line. There is even a website devoted to collecting performance stats in a single location, WPO Stats, which includes case studies and experiments showing the impact of web performance optimization (WPO) on business metrics. • Statistics are good. I like them. The problem with statistics is they can be taken out of context, misunderstood, and manipulated. • For example, say I want to know what will happen to my conversions if performance changes by one second. I found these four studies on WPO Stats. • Walmart saw a 2% increase in conversions for every one second improvement in load time. • Staples reduced median page load time by one second and conversions increased 10%. • Glasses Direct found that every second added to load time resulted in a 6.7% decrease in conversions • Shopzilla decreased load time by five seconds and saw a 12% increase in conversions. • Three of these studies refer to a one second change while Shopzilla refers to a five second change. I’ll simply divide 12 by 5 and say that for every second Shopzilla sees a 2.4% increase in conversions.
STOP! • We can’t make the assumption this is linear. It’s possible even with a one-second reduction in load • time, conversions would have increased by 12%. We don’t have the data, so we can’t make this • assumption. Likewise, we can’t say if Staples reduced load time by five seconds their conversions • would increase by 50%. • Excluding the Shopzilla study, we have three studies equating a one-second performance shift • to a change in conversions between 2 and 10%. Great, if I improve my page load by one second • my conversions will improve by between 2 and 10%. Doesn’t this chart look impressive! • NOT SO FAST. • When it comes to performance it is important to know what the baseline is. • Remember the 20% rule: a response time has to be 20% faster for an end user to perceive a change in performance. A one-second improvement will only make a difference to conversions if your baseline is less than five seconds. • The actual number of seconds or milliseconds shaved off your site’s performance doesn’t matter. • What matters is whether the improvements get you beyond the 20% threshold. • If I look for studies tying conversions to a percentage improvement in performance, I find ones • such as these: • AutoAnything reduced page load time by 50%, resulting in a 12-13% increase in sales. • Etam reduced page load time from 1.2 s to 500ms (58%), resulting in a 20% increase in conversions. • Obama for America site improved performance by 60%, resulting in a 14% increase in conversions.
Improving performance by 20% or more will result in increased conversions. Focusing on concrete numbers can result in going down a dreaded rat hole. Imagine being approached by the CFO after undertaking a performance improvement project and hearing: “The studies said a one second change in performance would give us 2-10% increase in conversions. Our performance improved by one second but our conversions haven’t increased. What did you do wrong?” Looking at case studies is important to see what is achievable and to help support your initiatives, but attempting to come up with a formula that can be applied across all sites that says every x seconds improvement equals z percentage improvement in conversions is simply wrong. No two sites are the same. No two ROI results will be the same. When examining case studies, understand the metrics and how they can be applied to your situation. Understanding the potential ROI of a project helps to make an informed decision. At Instart Logic, we created an eCommerce ROI calculator to help organizations determine the potential revenue gains from undertaking a performance optimization project. Check it out and see what becoming at least 20% faster might mean for your business.
Instart Logic is the world’s first endpoint-aware application delivery solution that makes websites and applications fast, secure, and easy to operate. Interested in learning more? Preview our image optimization capabilities in the Playground Contact Sales