Download
1 / 23
240 likes | 618 Views
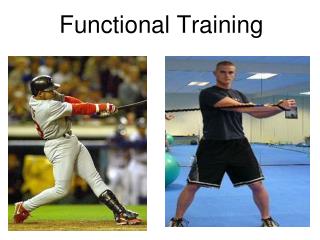
Functional linkage of watersheds and streams: ArcGIS FLoWS tools. David Theobald, John Norman, Erin Poston, Silvio Ferraz Natural Resource Ecology Lab, Dept of Recreation & Tourism, Colorado State University Fort Collins, CO 80523 USA 26 July 2005. Project context.

E N D
Functional linkage of watersheds and streams: ArcGIS FLoWS tools David Theobald, John Norman, Erin Poston, Silvio Ferraz Natural Resource Ecology Lab, Dept of Recreation & Tourism, Colorado State University Fort Collins, CO 80523 USA 26 July 2005
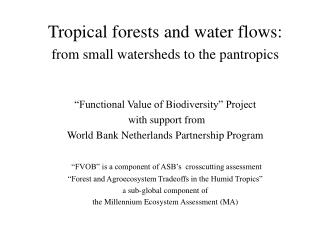
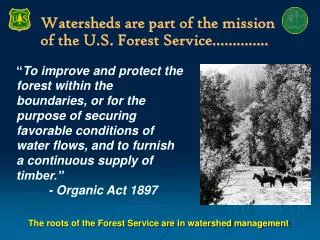
Project context • Challenges of STARMAP (EPA STAR): • Addressing science needs Clean Water Act • Integrate science with states/tribes needs • Assisting statisticians to test tenable hypotheses generated using understanding of ecological processes Goal: to find measures that more closely represent our understanding of how ecological processes are operating
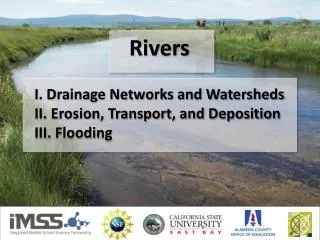
From watersheds/catchments as hierarchical, overlapping regions… River continuum concept (Vannote et al. 1980)
… to network of catchments Benda et al. BioScience 2004
SCALE: Grain Landscape River Network Microhabitat Microhabitat COARSE Climate Atmospheric deposition Geology Topography Soil Type Network Connectivity Stream Network Nested Watersheds Connectivity Flow Direction Network Configuration Drainage Density Confluence Density Vegetation Type Basin Shape/Size Land Use Topography Segment Contributing Area Segment Tributary Size Differences Network Geometry Localized Disturbances Land Use/ Land Cover Reach Riparian Zone Riparian Vegetation Type & Condition Floodplain / Valley Floor Width Cross Sectional Area Channel Slope, Bed Materials Large Woody Debris Overhanging Vegetation Substrate FINE Biotic Condition, Substrate Type, Overlapping Vegetation Detritus, Macrophytes Shading Detritus Inputs Biotic Condition
USGS NHD, NED
FLoWS v1 tools for ArcGIS v9.0… • Will migrate to v9.1
“true” catchments “adjoint” catchments Segments Pre-processing segment contributing areas (SCAs) Automated delineation • Inputs: • stream network (from USGS NHD 1:100K) • topography (USGS NED, 30 m) • Process: • “Grow” contributing area away from segment until ridgeline • Uses WATERSHED command
Segments are linked to catchments • 1 to 1 relationship • Properties of the watershed can be linked to network for accumulation operation
Landscape networks with Python • Need to represent relationships between features • Using graph theory, networks • Retain tie to geometry of features • Flow relationships table (like NHD, but flow-sorted!) • Implementation in ArcGIS • Geometric Networks (ESRI – complicated, slow) • Landscape Networks: Open, simple, fast • Began with VBA (1.5 years), moved to Python (2 months)
Selections • Downstream
Example: Flow modification Deynesius and Nilsson, Science (1994) – 77% of upper 1/3 of northern hemisphere rivers are strongly or moderately affected - F = regulated/total channel length - R = % of VMAD (cumulative reservoir live, gross capacity) Network-based flow modification 1. Degree of modification to flow = cumulative annual flow – cum. dam max. storage: Q’ = Q-S 2. Proportion of modified to VMAD (“natural”) flow: F = Q’/Q Collaboration with Aquatic ecologists (Poff, Merritt) RCL TCL
1. DEM 2. Slope 3. Flow dir. 4. Flow acc. 5. Hydro dist. Reservoirs Dam “shadow” High
Next steps • Increase range of applications • Attach additional datasets to SCA database • Land cover (urban, ag, “natural”) • Historical, current, future housing density • Indexing of National Inventory of Dams? • From segments to geomorphological reaches, gradient • Project/tool website: • www.nrel.colostate.edu/projects/starmap
CR - 829095 Thanks! • Comments? Questions? • Funding/Disclaimer: The work reported here was developed under the STAR Research Assistance Agreement CR-829095 awarded by the U.S. Environmental Protection Agency (EPA) to Colorado State University. This presentation has not been formally reviewed by EPA. The views expressed here are solely those of the presenter and STARMAP, the Program (s)he represents. EPA does not endorse any products or commercial services mentioned in this presentation. • FLoWS: www.nrel.colostate.edu/projects/starmap • davet@nrel.colostate.edu