Download

1 / 57
570 likes | 1k Views
Population. According to the non-profit group Population Connection (formerly ZPG) there are 6,641,215,403 people in the world, up from a figure of 6,603,567,010 the last time I taught this course (Spring 2007). We’ve added over 37.6 million people in that time. .

E N D
According to the non-profit group Population Connection (formerly ZPG) there are 6,641,215,403 people in the world, up from a figure of 6,603,567,010 the last time I taught this course (Spring 2007). We’ve added over 37.6 million people in that time.
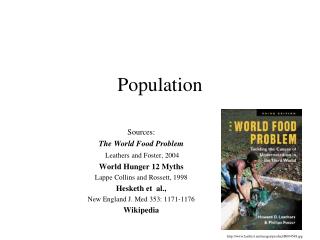
Since 1965, world population has more than doubled. Neo-Malthusians or “Population Bombers” (e.g., Paul Ehrlich, Lester Brown, Garret Hardin, and David Pimentel) have long argued that we are in danger of exceeding Earth’s carryingcapacity. • Over the past few years, we have experienced the slowest growth since the 1940s. Cornucopians or “Population Optimists” (e.g., Julian Simon) believe that population is not that big a problem and that economic growth and technology will see us through. • Still others claim that our focus on human population growth is misplaced. They view excessive growth as a symptom of other bigger problems. People in this camp are “Gender Equity” or “Equity” Advocates. • More on these perspectives later . . .
As environmental geographers, we are interested in knowing . . . • What significant population patterns are out there • Why these patterns exist and persist • Where significant population growth is occurring today • Where populations have stopped growing (or at least slowed down) • What the environmental impacts of population growth are
If one were to analyze a series of world population density maps published over the past several decades, two important points emerge: 1) Population is not distributed uniformly around the world. • Some areas support large populations (One out of every three people in the world is from either India or China); other areas are very sparsely populated. 2) Population patterns and rates of growth change over time. • With respect to growth rates, there are tremendous disparities around the world. We live in “two very different demographic worlds,” one relatively small, old, and wealthy (with very high consumption rates per capita) and the other very large, young, and poor (with relatively low consumption rates per capita).
Speaking of Consumption . . . • If everyone in the world consumed like the average U.S. citizen, we would need four more planet Earths to meet everyone’s needs!
Population Distribution • MDCs account for 20% of world population but consume the lion’s share of resources. Some countries (e.g., Denmark, Sweden) have reached ZPG (births plus immigration = deaths plus emigration); others have negative growth rates (e.g., Italy, Germany, Hungary, Japan). • LDCs account for 80% of world population. Some countries (esp. in the Middle East and Africa south of the Sahara) have very high growth rates. Nigeria - the most populous country in Africa - had 33 million inhabitants in 1950. By 2050, it is projected to have 300 million. • By 2025, MDCs will account for only 16% of world population. This is because over 90% of population growth over the next 30 years will occur in LDCs (esp. “hot spots” Africa and Middle East)
Demographic Momentum • In at least 68 countries, more than 40% of the population is under the age of 15. • Afghanistan (42.9%), Benin (47.9), Cambodia (45.4), Ethiopia (46.0), Haiti (42.6), Pakistan (41.8), Syria (46.1), Libya (48.3)
Over the next class period or two, we’ll examine these and other issues more closely, as well as explore different ways of looking at population growth & distribution: • different types of maps • population pyramids • different perspectives
A couple of things to remember about maps and numbers . . . 1) maps are generalizations, interpretive tools - we need to read them carefully 2) population by political boundaries can be deceiving 3) population numbers can be deceiving
On October 12, 1999, the UN announced that world population had officially reached 6 billion people. • How accurate were the data upon which this statement was made? • Some countries do not have reliable census data. Some countries may wish to overstate or understate their populations. Why?
World Population Concentrations • East Asia • South Asia • Southeast Asia • Western Europe • N.E. U.S./S.E. Canada
Axiom for the day . . . People live where they can eat! • People tend to live in arable areas • People tend to live in areas that are accessible (especially by water) • People tend to migrate to areas where others have migrated
Historically, what has caused world population to grow? When we look at world population growth over the past several thousand years, we see that it has not grown evenly. There have been spurts in growth.
Spurts in population growth (Three Revolutions) • ca. 8000 B.C. - Agricultural Revolution (plant and animal domestication) • ca. 1750 A.D. - Industrial Revolution (agricultural mechanization, transport, sanitation, health) • ca. 1950 A.D. - Medical Revolution (elimination of many historical causes of death)
And it keeps on growing . . . It took all of human history to reach 1 billion people in 1804. Then it only took 150 years to reach 3 billion by 1960. And as I noted earlier, world population has doubled since 1965.
How do we measure population changes? • Rate of Natural Increase - Percentage by which a population grows in a year (birth rate minus death rate). Does not take migration into account. Current rate is about 1.3%. • Doubling time - Number of years needed to double a population. Current doubling time is about 53 years for the world (Calculated by dividing 70 by the natural increase rate). • Recent evidence suggests . . . • that population growth is slowing down • that doubling time is increasing
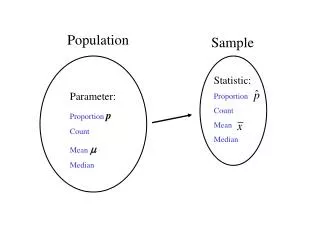
Geographers also look at . . . • crude birth rate - total number of live births in a year per 1000 • crude death rate - total number of deaths in a year per 1000
Geographers also look at . . . • total fertility rate - number of children a woman will have during child-bearing years (ages 15-49)
Fertility Rates (Cont’d) • Some demographers argue that births per male is a more effective measure. • Average fertility rate for the world is 2.7;2.1 in the U.S. • Fertility rates across the globe have been on the decline over the past 50 years - except in Africa. In Mexico, the average family in 1975 had 7 children. In 2000, the average was down to 2.5. • China introduced a policy known as “later, longer, fewer” in 1971 followed by a 1 child per family policy since 1979 which has reduced the fertility rate. The rate has dropped from 6.2 in 1949 to 1.6 in 2006. Negative side effects - female infanticide and bride abduction. • Family planning Iran has also lowered fertility rates.
Geographers also look at . . . • infant mortality rate - number of infant deaths (<1 year) per 1000 live births • 95 percent of the estimated 529,000 maternal deaths in 2000 occurred in Africa and Asia. • life expectancy - number of years a newborn infant can be expected to live • Even in the U.S. there are pockets where infant mortality is high and life expectancy is low for some members of society (e.g., Native American Indians).
Why is population increasing at different rates in different countries? • To answer this, we’ll talk about demographic transition (demographer Frank Notestein ca. 1945) and then take a look at population pyramids. • Nearly all the population growth is occurring in poorer countries - those countries least able to support the growth.
Demographic Transition - Process of change in a society’s population • process with four stages (based on European and North American experiences) • every country in the world can be grouped into one of four stages:
What lowers the death rate? • food security • improvements in water supply and sanitation • improvements in medicine Why does birth rate drop after death rate? • decision to have fewer children is a cultural one • fewer children needed in an industrial society • fewer children needed in an urban society • highereducation and personalfreedom for women tend to lower birth rates
A couple of questions: Do people base their decision on whether or not to have children in purely economic terms? • Children are valued in different ways (e.g., Where there is little opportunity for upward mobility, children offer status) Is the DTM an accurate predictor of trends in LDCs? • Some LDCs stuck in Stage 2 (Birth rates have remained high after urbanization and industrialization) • There may be a cultural preference in some countries to have larger families
Population Pyramids • An analytical tool, a bar graph, that allows us to examine the distribution of a country’s population by age and gender. • Tells us something about dependency (young and old). • Tells us something about the future as well (demographic momentum). • The shape of a pyramid is determined by the crude birth rate.
Population Projections for Nigeria (2000, 2025, 2050)
Population Projections for Hungary (2000, 2025, 2050)
Population Projections for U.S. (2000, 2025, 2050)
Population Projections for Chile (2000, 2025, 2050)
“Because labor was scarce and land plentiful, a low person/land ratio existed. Hence, each family had to reproduce its own labor force, and population grew rapidly during the seventeenth and eighteenth centuries. Industrialization ultimately helped to bring about a demographic transition to smaller families, as children ceased to become an economic asset. In Sturbridge, Massachusetts, for instance, women marrying between 1730 and 1759 bore an average of 8.8 children, whereas those marrying between 1820 and 1839 bore an average of 5.3 children. Nationwide, women who married in 1800 bore an average of 6.4 children, but in 1849 the figure was 4.9 children and in 1879 it was 2.8 children.” - Carolyn Merchant
Overpopulation? • What does overpopulation mean?Population exceeds carrying capacity. • What does carrying capacity mean? The maximum population that the environment can support indefinitely. • Is there an overpopulation problem in the world today? In the U.S.?This is a debate that has been unfolding for centuries.
Overpopulation? Today the debate is carried on by . . . Neo-Malthusians (a group named for English economist ThomasMalthus) Gender-Equity and Equity advocates (who trace their roots to the writings of KarlMarx), and Cornucopians (best represented by the work of the late economist and statistician JulianSimon)