Download

1 / 4
0 likes | 3 Views
Mastering stock charts and patterns is crucial for informed decision-making. If you're eager to enhance your skills further, consider Stock Market Classes. Delhi Trading Academy offers the best online and offline Stock Market and Trading Classes, providing comprehensive insights into reading stock charts and patterns. Enroll with Delhi Trading Academy to boost your proficiency in navigating the dynamic world of stock trading.<br>

E N D
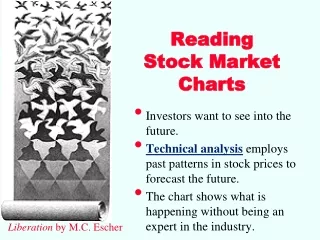
Reading Stock Charts and Patterns www.delhitradingacademy.in
1. Types of Charts: Line Charts: Displays closing prices over time. Bar Charts: Illustrates opening, closing, high, and low prices. Candlestick Charts: Provides a visual representation of price movements. 2. Basic Chart Patterns: Head and Shoulders: Indicates trend reversal. Double Tops and Bottoms: Signals potential trend reversal. Triangles (Symmetrical, Ascending, Descending): Indicates consolidation before a breakout. 3. Trend Lines: Uptrend Line: Connects higher lows. Downtrend Line: Connects lower highs. 4. Support and Resistance: Support: Price level where a stock often bounces back. Resistance: Price level where a stock may face selling pressure. 5. Moving Averages: Simple Moving Average (SMA): Average price over a specified period. Exponential Moving Average (EMA): Gives more weight to recent prices. www.delhitradingacademy.in
6. Relative Strength Index (RSI): Measures the magnitude of recent price changes to evaluate overbought or oversold conditions. 7. Recognizing Patterns: Cup and Handle: Bullish continuation pattern. Pennant: Indicates a brief consolidation before a continuation of the trend. 8. Volume Analysis: Analyzing trading volume helps confirm trends and potential reversals. 9. Chart Timeframes: Short-term charts (e.g., hourly) for intraday trading. Long-term charts (e.g., weekly) for broader trends. 10. Risk Management: Set stop-loss orders based on support and resistance levels. www.delhitradingacademy.in
Understanding the techniques of the stock market is essential for anyone looking to invest. Enroll Now in the Stock Market Classes, offered by Delhi Trading Academy, can be a valuable step toward building financial knowledge and confidence. Call Now for best Advice and Inquiry - +91 9971868883 www.delhitradingacademy.in