Download
1 / 40
520 likes | 976 Views
Reading charts and graphs Interpreting Data. Reading charts and graphs. Bridging the gap to. L3. L4. Welcome to all learners! Click to read on …. Do You … - know how to read bar charts?. You need a slide show that is … - Clear! - easy to follow

E N D
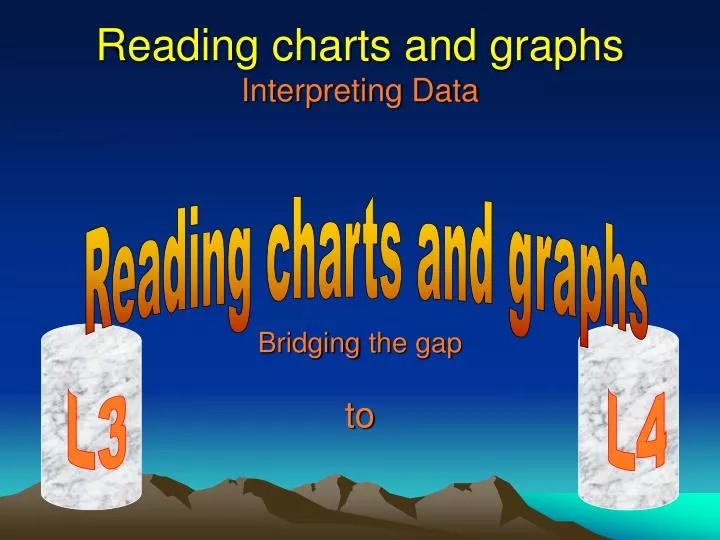
Reading charts and graphsInterpreting Data Reading charts and graphs Bridging the gap to L3 L4
Welcome to all learners!Click to read on … Do You … - know how to read bar charts? You need a slide show that is … - Clear! - easyto follow - learner-friendly: 1 step at a time - for beginners AND revisers! This slide show will … - Give you a user-friendly way to read bar charts!
Reading bar charts How to use this resource You can control how fast or slow you go, using: FORWARD:OR OREnter OR Left-hand mouse BACK:OR ORBack Space TO START SLIDESHOW: F5 OR Slide Show > View Show TO END SLIDESHOW: Escape
Reading bar chartsInterpreting Data If you want to get the BIG PICTURE first about Data Handling … … why not try the introductory slide show: “Introduction to Data Handling” ! at www.bgfl.org/mathsbooster (School Booster)
“1 in 30 Birmingham Pupils is a Giant!” Reading bar charts Recap: 3 Steps in Data Handling Interpret the data Explain it! … Say what it means! Draw some conclusions! Organise & display the data So it’s easier to see a meaning - lists … tables … charts … graphs … diagrams Height Number less than 150cm high 9 less than 150cm high 20 more than 200cm high 1 30 1. Collect the data Get the information you need 6K’s bedtimes: 8:30pm, 8:00 pm, 7:45 pm, 9:30 pm, 7:00 pm, 10:00 pm, 7:20 pm, 8:15pm, 7:29 pm, 11:45 pm, 8:50 pm, 8:15 pm, 9:00 pm, 7:18 pm, 9:25 pm, 10:30 pm, 8:18 pm
Reading bar charts Recap: 3 Steps in Data Handling Height Number less than 150cm high 9 less than 150cm high 20 more than 200cm high 1 30 Step 1. Collect the data Step 2. Organise & display the data Step 3. Interpret the data 6K’s bedtimes: 8:30pm, 8:00 pm, 7:45 pm, 9:30 pm, 7:00 pm, 10:00 pm, 7:20 pm, 8:15pm, 7:29 pm, 11:45 pm, 8:50 pm, 8:15 pm, 9:00 pm, 7:18 pm, 9:25 pm, 10:30 pm, 8:18 pm “1 in 30 Birmingham Pupils is a Giant!”
Reading bar charts Recap: The Traffic Lights Method RED: STOP AND LOOK! … AT THETitle Axes Numbers and scale AMBER: GET READY TO READ! Turn each bar into English so that the graph makes sense before you start … Always Make Bars Easy Reading GREEN: GO AND READ THE GRAPH! SAY WHAT YOU SEE - The tallest bar? Shortest bar? Differences between the bars?
Reading bar charts Example 1
Example 1 Reading bar charts RED: STOP AND LOOK AT: TitleAxes Numbers and scale 10 9 8 7 6 5 4 3 2 1 0 Where is the title? 6K’s Bedtimes Number of pupils What does the title say the graph is about? 7pm 8pm 9pm 10pm 11pm . to to to to to 8pm 9pm 10pm 11pm Midnight Bedtime
Example 1 Reading bar charts RED: STOP AND LOOK AT: Title AxesNumbers and scale 10 9 8 7 6 5 4 3 2 1 0 Where is the x-axis? 6K’s Bedtimes Number of pupils What does the x-axis show? In this survey, borderline results were put in the higher bar. Answer It doesn’t matter – as long as you decide the same rule for all results! Question What if a pupil says that they go to 8pm? Should their data go into the 1st or 2nd bar? 7pm 8pm 9pm 10pm 11pm. to to to to to8pm 9pm 10pm 11pm Midnight Bedtime
Example 1 Reading bar charts RED: STOP AND LOOK AT: Title AxesNumbers and scale 10 9 8 7 6 5 4 3 2 1 0 Where is the y-axis? 6K’s Bedtimes Number of pupils What does the y-axis show? 7pm 8pm 9pm 10pm 11pm . to to to to to 8pm 9pm 10pm 11pm Midnight Bedtime
Example 1 Reading bar charts RED: STOP AND LOOK AT: Title Axes Numbers and scale 10 9 8 7 6 5 4 3 2 1 0 What x numbers do we have? What y numbers do we have? 6K’s Bedtimes 5 bedtime slots from 7pm to Midnight. Number of pupils What scale? 1 hour bedtime slots. 1 -10: easy numbers! 7pm 8pm 9pm 10pm 11pm . to to to to to 8pm 9pm 10pm 11pm Midnight What scale? The y-axis goes up in 1’s - so it’s very easy to read! Bedtime
Example 1 Reading bar charts AMBER: GET READY TO READ! Always Make Bars Easy Reading Translate each bar into a sentence! 10 9 8 7 6 5 4 3 2 1 0 6K’s Bedtimes 10 pupils go to bed between 8pm and 9pm. 9 pupils go to bed between 7pm and 8pm. 8 pupils go to bed between 9pm and 10pm. Number of pupils Click here for Translator: Maths to English 2 pupils 10-11pm. 1 pupil after 11 7pm 8pm 9pm 10pm 11pm . to to to to to 8pm 9pm 10pm 11pm Midnight Bedtime
Example 1 Reading bar charts GREEN: GO AND READ! – the tallest and shortest Mode Most popular (1 kind of average) The tallest bar means …? 10 9 8 7 6 5 4 3 2 1 0 TALLEST BAR 8pm - 9pm isthe most popularbedtime. 6K’s Bedtimes 10 pupils go to bed between 8pm and 9pm. Number of pupils SHORTEST BAR 11pm - Midnight is theleast popularbedtime. The shortest bar means …? 1 pupil after 11 7pm 8pm 9pm 10pm 11pm . to to to to to 8pm 9pm 10pm 11pm Midnight Bedtime
Example 1 Reading bar charts GREEN: GO AND READ! 6 ways to say what you see – about the mode 10 9 8 7 6 5 4 3 2 1 0 10 pupils go to bed between 8pm and 9pm. OR … The modal bedtime is 8pm to 9pm. Number of pupils OR … The most popular bedtime is 8pm to 9pm. OR … Most Y6K pupils go to bed between 8pm to 9pm. OR … The most common bedtime is 8pm to 9pm. 7pm 8pm 9pm 10pm 11pm . to to to to to 8pm 9pm 10pm 11pm Midnight OR … The most frequent bedtime is 8pm to 9pm. Bedtime OR … The bedtime with the highest frequency is 8pm to 9pm.
Example 1 Reading bar charts GREEN: GO AND READ! – compare the bars 6 more pupils go to bed 9pm - 10pm than those who go at 10pm - 11pm. 8= 2+ 6 10 9 8 7 6 5 4 3 2 1 0 6K’s Bedtimes 9 fewer pupils go to bed 11pm - Midnight than those who go between 8pm - 9pm. 10– 9 = 1 Number of pupils 5 times as many pupils go to bed 8pm - 9pm as those who retire 10pm - 11pm. 10= 5 x2 Halfas many pupils go to bed 11pm - Midnight as those who go between 10pm – 11pm. 1= 1/2 of 2 7pm 8pm 9pm 10pm 11pm . to to to to to 8pm 9pm 10pm 11pm Midnight Can you find some other things to say about this graph? You might want to use: ‘more than’ + ‘fewer than’ - ‘times’ x ‘of’ ÷ Bedtime
Example 1 Reading bar charts GREEN: GO AND READ! – the total of the bars TOTAL OF ALL BARS = Total number of pupils … 9 10 8 2 + 1 . Total = ? 10 9 8 7 6 5 4 3 2 1 0 The total of all bars means …? 6K’s Bedtimes 10 pupils 9 pupils 8 pupils Number of pupils 2 pupils 1 pupil 7pm 8pm 9pm 10pm 11pm . to to to to to 8pm 9pm 10pm 11pm Midnight Bedtime Total = 30 pupils
Example 1 Reading bar charts GREEN: GO AND READ! - the graph shape 6K’s Bedtimes 6L’s Bedtimes 6M’s Bedtimes Can you tell anything from this graph shape? What about the shape of this graph? … and this one? More pupils go to bed earlier rather than later! Roughly the same number of pupils go to bed earlier and later More pupils go to bed later rather than earlier!
Reading bar charts Example 2 6K have a fantastic football team! Their captain collected data on how many goals the 6K team scored in each match…
Example 2 Reading bar charts RED: STOP AND LOOK AT: TitleAxes Numbers and scale 10 9 8 7 6 5 4 3 2 1 0 Where is the title? 6K’s goal score per game Frequency What does the title say the graph is about? 1 2 3 4 5 Number of goals
Example 2 Reading bar charts RED: STOP AND LOOK AT: Title AxesNumbers and scale 10 9 8 7 6 5 4 3 2 1 0 Where is the x-axis? 6K’s goal score per game Frequency What does the x-axis show? 1 2 3 4 5 Number of goals
Example 2 Reading bar charts RED: STOP AND LOOK AT: Title AxesNumbers and scale 10 9 8 7 6 5 4 3 2 1 0 Where is the y-axis? 6K’s goal score per game Frequency What does the y-axis show? 1 2 3 4 5 Number of goals
Example 2 Reading bar charts RED: STOP AND LOOK AT: Title Axes Numbers and scale 10 9 8 7 6 5 4 3 2 1 0 What x numbers do we have? What y numbers do we have? 6K’s goal score per game 5 goal scores1 - 5 Frequency What scale? Goes up in 1’s 1 -10: easy numbers! 1 2 3 4 5 What scale? The y-axis goes up in 1’s - so it’s very easy to read! Number of goals
Example 2 Reading bar charts AMBER: GET READY TO READ! Always Make Bars Easy Reading Translate each bar into a sentence! 10 9 8 7 6 5 4 3 2 1 0 6K’s goal score per game There are 10 2-goal matches There are 9 1-goal matches There are 8 3-goal matches Frequency Click here for Translator: Maths to English 2 4-goal matches 1 5-goal match 1 2 3 4 5 Number of goals
Example 2 Reading bar charts GREEN: GO AND READ! – the tallest and shortest Mode Most popular (1 kind of average) The tallest bar means …? 10 9 8 7 6 5 4 3 2 1 0 TALLEST BAR 2 goals isthe most populargoal score 6K’s goal score per game There are 10 2-goal matches Frequency SHORTEST BAR 5 goals is theleast populargoal score The shortest bar means …? 1 5-goal match 1 2 3 4 5 Number of goals
Example 2 Reading bar charts GREEN: GO AND READ! 6 ways to say what you see – about the mode 10 9 8 7 6 5 4 3 2 1 0 There are 10 2-goal matches Frequency OR … The modalgoal score is 2. OR … The most populargoal score is 2. OR … More matches score 2 goals than any other score. OR … The most commongoal score is 2. 1 2 3 4 5 OR … The most frequentgoal score is 2. Number of goals OR … The goal score with the highest frequency is 2 goals.
Example 2 Reading bar charts GREEN: GO AND READ! – compare the bars There are 6 more 3-goal matches than there are 4-goal matches. 8= 2+ 6 10 9 8 7 6 5 4 3 2 1 0 6K’s goal score per game There are 9 fewer 5-goal matches than there are matches 2-goal matches 10– 9 = 1 Frequency There are 5 times as many 2-goal matches as there are 4-goal matches. 10= 5 x2 Halfas many matches scored 5 goals as matches which scored 4 goals. 1= 1/2 of 2 1 2 3 4 5 Can you find some other things to say about this graph? You might want to use: ‘more than’ + ‘fewer than’ - ‘times’ x ‘of’ ÷ Number of goals
Example 2 Reading bar charts GREEN: GO AND READ! – the total of the bars TOTAL OF ALL BARS = Total number of matches … 9 10 8 2 + 1 . Total = ? 10 9 8 7 6 5 4 3 2 1 0 The total of all bars means …? 6K’s goal score per game 10 matches 9 matches 8 matches Frequency 2 matches 1 match 1 2 3 4 5 Number of goals Total = 30 matches
Example 2 Reading bar charts GREEN: GO AND READ! - the graph shapeWhich class has the best football team? 6K’s goal score per game 6L’s goal score per game 6M’s goal score per game Can you tell anything from this graph shape? What about the shape of this graph? … and this one? 6K played more low-scoring matches than high-scoring matches! 6L played roughly an equal number of low-scoring and high scoring matches. 6M played more high-scoring matches than low-scoring matches!
Reading bar charts Example 3 Mr Cruncher is going to teach Year 6 (6K and 6L) about bar charts (yey!) He decides to test them first to see what they already know …
Example 3 Reading bar charts RED: STOP AND LOOK AT: TitleAxes Numbers and scale 20 18 16 14 12 10 8 6 4 2 0 Where is the title? Y6 Test Results Number of pupils What does the title say the graph is about? 1 - 20 21 - 40 41 – 60 61 – 80 81 – 100 E D C B A Marks out of 100
Example 3 Reading bar charts RED: STOP AND LOOK AT: Title AxesNumbers and scale 20 18 16 14 12 10 8 6 4 2 0 Where is the x-axis? Y6 Test Results Number of pupils What does the x-axis show? 1 - 20 21 - 40 41 – 60 61 – 80 81 – 100 E D C B A Marks out of 100
Example 3 Reading bar chartsRED: STOP AND LOOK AT: Title AxesNumbers and scale 20 18 16 14 12 10 8 6 4 2 0 Where is the y-axis? Y6 Test Results Number of pupils What does the y-axis show? 1 - 20 21 - 40 41 – 60 61 – 80 81 – 100 E D C B A Marks out of 100
Example 3 Reading bar charts RED: STOP AND LOOK AT: Title Axes Numbers and scale 20 18 16 14 12 10 8 6 4 2 0 What x numbers do we have? What y numbers do we have? Y6 Test Results 5 grades covering marks from 1 to 1 – 100. Number of pupils What scale? 20 marks per grade. 1 – 20, quite easy numbers 1 - 20 21 - 40 41 – 60 61 – 80 81 – 100 E D C B A What scale? The y-axis goes up in 2’s - A little harder to read (so take care!) Marks out of 100
Example 3 Reading bar charts AMBER: GET READY TO READ! Always Make Bars Easy Reading Translate each bar into a sentence! 20 18 16 14 12 10 8 6 4 2 0 Y6 Test Results 20 pupils scored a D 18 pupils scored an E 16 pupils scored a C. Number of pupils Click here for Translator: Maths to English 4 pupils scored a B 2 pupils scored A 1 - 20 21 - 40 41 – 60 61 – 80 81 – 100 E D C B A Marks out of 100
Example 3 Reading bar charts GREEN: GO AND READ! – the tallest and shortest Mode Most popular (1 kind of average) The tallest bar means …? 20 18 16 14 12 10 8 6 4 2 0 TALLEST BAR Grade D isthe most populartest result. Y6 Test Results 20 pupils scored a D Number of pupils SHORTEST BAR Grade A is theleast populartest result. The shortest bar means …? 2 pupils scored A 1 - 20 21 - 40 41 – 60 61 – 80 81 – 100 E D C B A Marks out of 100
Example 3 Reading bar charts GREEN: GO AND READ! 6 ways to say what you see – about the mode 20 18 16 14 12 10 8 6 4 2 0 20 pupils scored a D OR … The modaltest result is a D! Number of pupils OR … The most populartest result is a D. OR … Most Y6K pupilsscored a D. OR … The most commontest result is a D. 1 - 20 21 - 40 41 – 60 61 – 80 81 – 100 E D C B A OR … The most frequenttest result is a D. Marks out of 100 OR … The test result with the highest frequency is a D.
Example 3 Reading bar charts GREEN: GO AND READ! – compare the bars 12 more pupils scored a C than a B. 16= 4+ 12 20 18 16 14 12 10 8 6 4 2 0 Y6 Test Results 18 fewer pupils scored an A than a D. 20– 18 = 2 Number of pupils 5 times as many pupils scored a D as a B. 20= 5 x4 Halfas many pupils scored an A as a B. 2= 1/2 of 4 1 - 20 21 - 40 41 – 60 61 – 80 81 – 100 E D C B A Can you find some other things to say about this graph? You might want to use: ‘more than’ + ‘fewer than’ - ‘times’ x ‘of’ ÷ Marks out of 100
Example 3 Reading bar charts GREEN: GO AND READ! – the total of the bars TOTAL OF ALL BARS = Total number of pupils 18 20 16 4 + 2 . Total = ? 20 18 16 14 12 10 8 6 4 2 0 The total of all bars means …? Y6 Test Results 20 pupils 18 pupils 16 pupils Number of pupils 4pupils 2pupil 1 - 20 21 - 40 41 – 60 61 – 80 81 – 100 E D C B A Marks out of 100 Total = 60 pupils
Reading bar charts The next step! Did you know that reading bar charts is one of the trickiest brain-teasing tightropes in maths you can try! Now that you’ve tackled this topic, why not try some of the other maths boosters? You can check out some of the other slide shows at: www.bgfl.org/mathsbooster (School Booster)