Download
1 / 15
150 likes | 160 Views
Dr Amii Harwood of the University of East Anglia discusses Assessing Regional Green Infrastructure Provision as part of the 2018 Business and Local Government Data Research Centre conference Bringing Data to Life for Policy and Practice

E N D
Assessing Regional Green Infrastructure Provision Prof Andrew Lovett, Dr Amii Harwood, Dr Gisela Sunnenberg amii.harwood@uea.ac.uk 27 November 2018
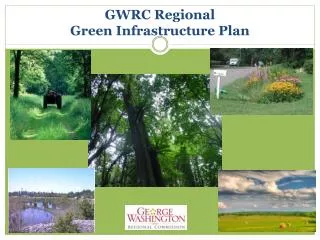
What is Green Infrastructure? Source: Kevin Millican, Flickr (CC BY-NC-ND 2.0) Source: European Commission, 2013. Building a Green Infrastructure for Europe.
Project Aim • Many local authorities created their own GI datasets in response to PPG17 (2002). • Far fewer of these have been regularly updated. • Consistent information on county or regional scales is also relatively unusual. • Addressing the data challenge: • Can details from open data help fill this gap?
Open source data Volunteered Geographic Information Collaboratively collected geodata e.g. OpenStreetMap (OSM) • Rapid updates • Local knowledge • Range of attributes
Method: Blending datasets OpenStreetMap(OSM) OS MasterMap (OS MM) Select features supporting GI Union of datasets (retain origin and description) Regional Green Infrastructure Map (OSM & OS MM Blend)
Data processing: example OSM OS MM OSM & OS MM Blend
No Norwich: OS Open Greenspace
No Norwich: OS MM Greenspace
Regional Distributions GI from OS Open GI from OSM & OS MM GI from CORINE 2012 Contains OS data © Crown copyright and database right (2018)
Composition of the OSM & MM Blend Population density (2014) % of Features only in OS MM % of Features only in OSM Contains OS data © Crown copyright and database right (2018)
Socio-Economic Associations Spearman rank correlations: significant association at 95 confidence level are in bold font. The OSM-OS MM blended product identifies more greenspace than OS Open Greenspace data or CORINE Land Cover categories, but shows socio-economic associations that need to be kept in mind.
Thank you Dr Amii Harwood amii.harwood@uea.ac.uk 27 November 2018