Download
1 / 55
550 likes | 837 Views
Sting: a TCP-based Network Measurement Tool. Stefan Savage (Department of Computer Science and Engineering, University of Washington, Seattle)Published in Proceedings of USENIX Symposium on Internet Technologies and Systems (USITS '99), October 1999. Features. Can measure the packet loss rate on both the forward and reverse paths between a pair of hostsOnly uses the TCP algorithmTarget only needs to run a TCP service, such as a web server.

E N D
1. TCP-Related Measurements Presented by:
Charles Simpson (Robby)
September 30, 2003
3. Features Can measure the packet loss rate on both the forward and reverse paths between a pair of hosts
Only uses the TCP algorithm
Target only needs to run a TCP service, such as a web server
4. Forward Loss Data Seeding:
Source sends in-sequence TCP data packets to target, each of which will be a loss sample
Hole-filling:
Sends TCP data packet with sequence number one greater than the last seeding packet
If target ACKs this new packet, no loss
Else, each ACK indicates missing packets
Should be reliable, that is retransmissions must be made in Hole-filling
6. Reverse Loss Data Seeding:
Skip first sequence number, ensuring out-of-sequence data (Fast Retransmit)
Receiver will immediately acknowledge each data packet received
Measure lost ACKs
Hole-filling:
Transmit first sequence number
Continue as before
7. Sending Large Bursts
8. Results Loss rates increase during business hours, and then wane
Forward and reverse loss rates vary independently
On average, with popular web servers, the reverse loss rate is more than 10 times greater than the forward loss rate
9. Forward Loss Results
10. Reverse Loss Results
11. �Popular� Web Servers
12. Random Web Servers
13. On Inferring TCP Behavior Jitendra Padhye and Sally Floyd (AT&T Center for Internet Research at ICSI (ACIRI))
Published in SIGCOMM �01
14. Features Developed a tool called TBIT (TCP Behavior Inference Tool) to characterize the behavior of remote web servers, bugs, and non-compliance
Based on Sting
15. Motivations and Requirements �Is it appropriate to base Internet simulation and analysis on Reno TCP?�
�What are the initial windows used in TCP connections in the Internet?�
Is end-to-end congestion control being used?
To identify and correct TCP implementation bugs
Testing the TCP behavior of the equipment en route to the target
Should be able to test any web server, any time
TBIT traffic should not be hostile, or even appear to be hostile (or anomalous)
16. Initial Value of Congestion Window (ICW) Sends TCP SYN to target, port 80, with large receiver window and desired MSS
Upon receiving SYN/ACK, HTTP 1.0 GET request is sent (along with ACK)
TBIT does not acknowledge any more packets, so the target will only send packets that fit in its ICW
Once TBIT sees a retransmission, it sends a RST to close the connection
17. ICW Results
18. Congestion Control Algorithm (CCA) Connection is established with a small MSS (~100 bytes) to force several packets to be sent (receiver window is set to 5*MSS)
Request is made
All packets are acknowledged up to 13th packet
This packet is dropped
The 14th and 15th packets arrive and are acknowledged (duplicate ACKs)
Packet 16 is dropped, all further packets are acknowledged
Connection is closed once 25 data packets are received, including retransmissions
19. CCA Results
20. Conformant Congestion Control (CCC) Connection is established and request made, with a small MSS
All packets acknowledged until packet 15 is received, which is dropped
All are ACKed, with duplicate ACKs sent for packet 14 until 15 is retransmitted (which is ACKed)
Size of reduced congestion window is the difference between the maximum sequence number received and the highest sequence number acknowledged
21. CCC Results
22. Response to SACK SYN with small MSS and SACK_PERMITTED sent
If SYN/ACK with SACK_PERMITTED is not received, test is terminated
Else packets are received and ACKed until packet 15 is received. 15, 17, and 19 are dropped and an appropriate SACK for 16 and 18 is sent
TBIT waits, sending appropriate SACKs, until 15, 17, and 19 are received
Connection is closed
23. Response to SACK Results
24. Time Wait Duration A three-way handshake (FIN, FIN/ACK, ACK) is used for closing connections
TCP standard specifies after ACKing the FIN, the target should wait 2*MSL (Maximum Segment Lifetime) before port can be reused
25. Time Wait Duration Results
26. Response to ECN ECN-setup SYN is sent
If no SYN/ACK is received after three retries, or if RST is received, TBIT concludes failure
Else, SYN/ACK is checked for ECN-setup (ECN_ECHO set, CWR unset)
HTTP request sent with ECT and CE bits set
If ACK is received, check for ECN_ECHO, else give up after three retries
27. Response to ECN Results
28. Interesting Result Many tests were terminated because the remote host sent packets with MSS larger than that set by the receiver
29. Future Work Further Tests of TCP implementation
DSACK (RFC 2883)
Limited Transmit (RFC 3042)
Congestion Window Validation (RFC 2861)
Test for Standards Compliance
Use TBIT to generate models of TCP implementations for simulators such as NS
30. On the Characteristics and Origins of Internet Flow Rates Yin Zhang and Lee Breslau (AT&T Labs � Research)
Vern Paxson and Scott Shenker (International Computer Science Institute)
Published in SIGCOMM �02
31. Features Developed tool, T-RAT (TCP Rate Analysis Tool), that analyzes TCP packet-level dynamics, by examining traces
They want to find the distribution of flow data transmit rates, as well as the causes of these rates
They examine the distribution of flow rates seen and investigate the relationship between these rates and other characteristics like flow size and duration
32. Rate Distribution Average rates vary over several orders of magnitude
Flow sizes more highly skewed than flow rates, probably due to unbounded sizes
Used Q-Q plot to determine fit to log-normal distribution, which was good
Find that most flows are not fast, but the fast flows account for a significant fraction of all traffic
They see a divide between large, fast flows and small, slow flows
36. Correlations Tested three correlations and found:
Duration and rate (negative correlation)
Size and rate (slightly positive correlation)
Duration and size (really strong correlation)
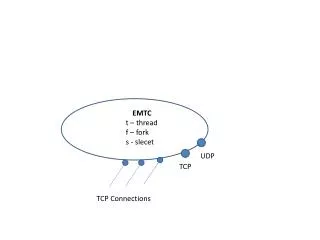
37. T-RAT Specifications Entire connection need not be observed
Trace can be recorded at arbitrary location
Tool works in a streaming fashion
Packets are grouped into flights, and the following is recorded:
The MSS is estimated
The RTT is estimated
The rate limit is estimated
38. T-RAT Rate Limiting Factors Opportunity Limited � limited amount of data to send
Congestion Limited � due to packet loss
Transport Limited � sender is in congestion avoidance, but doesn�t experience any loss
Receiver Window Limited � sender is limited by the receiver�s maximum advertised window
Bandwidth Limited � sender fully utilizes bandwidth
Application Limited � application does not produce data fast enough to be transport or bandwidth limited
39. Results (per bytes) Most common rate limiting factor is congestion (22% - 43% of bytes in traces)
Window limitations, more specifically receiver window, was the second most limiting factor
Other limitations did not really present themselves
41. Results (per flows) Most common are opportunity and application limitations (together, over 90% of all flows)
Other factors had little, if any, affect
Supports the conclusion that most flows are small and slow
Small � opportunity limited
Slow � application limited
Much more work to do
43. Passive Estimation of TCP Round-Trip Times Hao Jiang (Computer and Information Sciences, University of Delaware)
Constantinos Dovrolis (Computer and Information Sciences, University of Delaware)
To appear at the ACM Computer Communications Review, August 2002
44. Objectives �� to estimate the Round-Trip Times (RTTs) of the TCP connections that go through a network link, using passive measurements at that link.�
Using traces
Using only unidirectional flows
Must have IP and TCP headers and an accurate timestamp for each packet
45. Techniques SYN-ACK (SA) estimation
Flows from caller to callee
Slow-Start (SS) estimation
Flows from callee to caller
Must transfer at least five consecutive segments, the first four must be MSS packets
NOTE: These techniques are simple enough to be able to run on routers in real-time
Only one estimation is made per connection, which has been validated in �On Estimating End-to-End Network Path Properties,� by Mark Allman and Vern Paxson, SIGCOMM �99
46. SYN-ACK (SA) Estimation Basic Idea: �� RTT can be estimated from the time interval between the last-SYN and the first-ACK that the caller sends to the callee�
Three Conditions:
No delay
SYN/ACK cannot be lost, as well as first ACK
Low delay jitter
Still performs well when conditions are not met
48. Slow-Start (SS) Estimation MSS value can be estimated from trace, by comparing with �well-known� values
Basic Idea: �� the time spacing between the first and second bursts is roughly equal to the connection�s RTT.�
Delayed ACKs could become a problem, thus first burst must consist of at least two MSS packets
50. Direct Verification Compare SA and SS estimated RTT values with ping measurements
Accuracy threshold: The estimate must be within 5ms or 10%, whichever is larger, to the median ping measurement
Only 5-10% of SA estimates are outside the threshold
10-15% of SS estimates are outside the threshold
The errors seem worse on links with larger RTTs, probably due to jitter
51. Indirect Verification Using flows that contain both directions of a flow, the SA and SS estimates are compared to one another for the same flow
The two estimates are found to have an absolute difference less than 25ms in about 70-80% of the flows
52. RTT Distributions > 90-95% of the flows have an RTT < 500ms
In US links, > 75-90% of flows have RTT < 200ms
The lower bound seems to be on the order of a few milliseconds
More than 95% of the bytes transferred are from flows with RTT < 500ms
However, no correlation could be found between RTT and transfer size
53. OC3 link at Tel Aviv University
54. Different Timescales Tens of Seconds � Do not seem to change
Hours � Nighttime seems to have longer RTTs (due to traffic from abroad)
Days � There seems to be no consistent difference between the RTTs of weekdays and weekends
Months � RTTs seem to go down, probably due to link improvements
Obviously, hardcoding an RTT value is a bad idea
55. Future Work How can routers use these RTT estimations in real-time?
Required buffering
Active Queue Management
Detection of congestion unresponsive flows
What fraction of connections need to be measured to get a good approximation of the link�s RTT distribution?