Download
1 / 8
80 likes | 354 Views
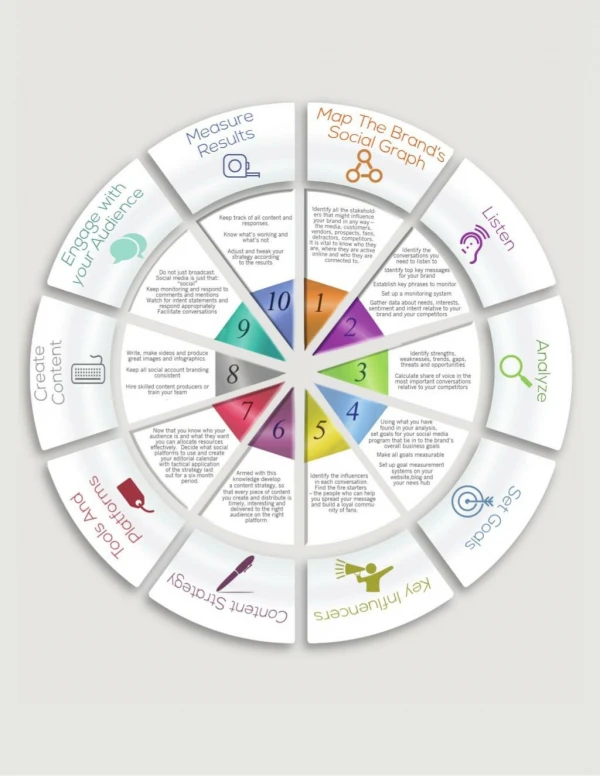
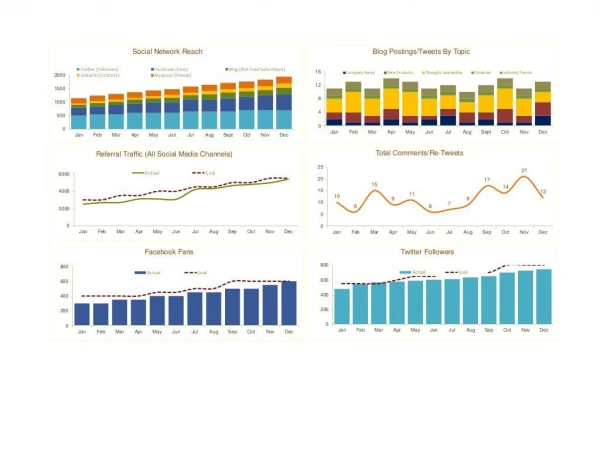
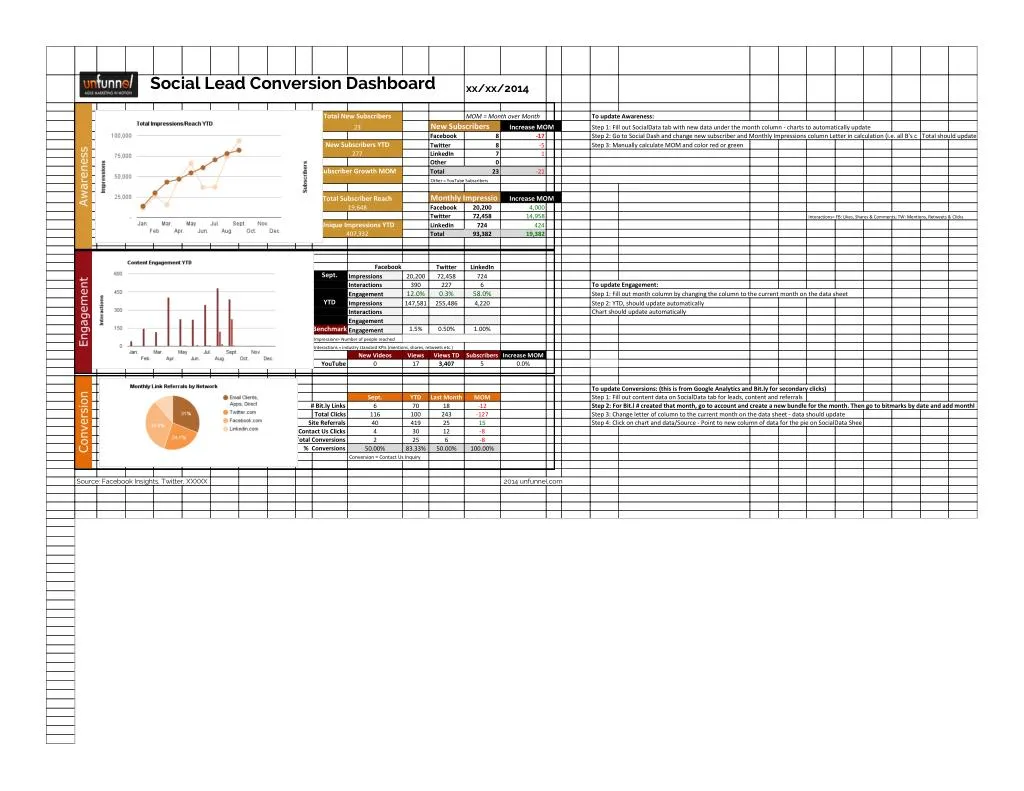
Measure online marketing goals, business objectives and leads captured from each of your social media channels. Use dynamic calculations to visualize: <br><br>IMPRESSIONS & REACH <br>Watch your brand awareness growth in the social channel by looking at the total of new subscribers and reach with impressions categorized by network. <br>CONTENT ENGAGEMENT <br>By looking at the % of interactions (shares, retweets, likes, etc.) by the # of impression, track how well you content is engaging your followers. <br>REFERRALS BY NETWORK <br>Use bitly links to see deeper insights on 2nd and 3rd generation traffic. Track lead conversions and attribute an ROI to the social channel. <br>DYNAMIC CALCULATIONS <br>Enter your data from multiple social tools or networks and automatically have it populate into chart visualizations.

E N D
Social Lead Conversion Dashboard xx/xx/2014 Total New Subscribers MOM = Month over Month New Subscribers To update Awareness: Increase MOM 23 Step 1: Fill out SocialData tab with new data under the month column - charts to automatically update Step 2: Go to Social Dash and change new subscriber and Monthly Impressions column Letter in calculation (i.e. all B's c Total should update Step 3: Manually calculate MOM and color red or green Facebook Twitter LinkedIn Other Total 8 8 7 0 -17 -5 New Subscribers YTD 277 1 Subscriber Growth MOM 23 -21 Other = YouTube Subscribers Monthly Impressio Total Subscriber Reach 19,648 Increase MOM Facebook Twitter LinkedIn Total 20,200 72,458 724 93,382 4,000 14,958 424 19,382 Interactions= FB: Likes, Shares & Comments; TW: Mentions, Retweets & Clicks Unique Impressions YTD 407,332 Facebook Twitter 72,458 227 0.3% 255,486 LinkedIn 724 6 58.0% 4,220 Sept. Impressions Interactions Engagement Impressions Interactions Engagement 20,200 390 12.0% 147,581 To update Engagement: Step 1: Fill out month column by changing the column to the current month on the data sheet Step 2: YTD, should update automatically Chart should update automatically YTD BenchmarkEngagement 1.5% 0.50% 1.00% Impressions= Number of people reached Interactions = industry standard KPIs (mentions, shares, retweets etc.) New Videos 0 Views 17 Views TD 3,407 Subscribers Increase MOM 5 YouTube 0.0% To update Conversions: (this is from Google Analytics and Bit.ly for secondary clicks) Step 1: Fill out content data on SocialData tab for leads, content and referrals Step 2: For Bit.l # created that month, go to account and create a new bundle for the month. Then go to bitmarks by date and add monthl Step 3: Change letter of column to the current month on the data sheet - data should update Step 4: Click on chart and data/Source - Point to new column of data for the pie on SocialData Shee Sept. 6 116 40 4 2 50.00% YTD 70 100 419 30 25 83.33% Last Month 18 243 25 12 6 50.00% MOM -12 -127 15 -8 -8 100.00% # Bit.ly Links Total Clicks Site Referrals Contact Us Clicks Total Conversions % Conversions Conversion = Contact Us Inquiry Source: Facebook Insights, Twitter, XXXXX 2014 unfunnel.com
Q3 Jan. Q4 Apr. Q1 Jul. Q2 Oct. TOTALS Social Media Analytics (FY14) Feb. Mar. May Jun. Aug. Sept. Nov. Dec. Jul. Social Media Overview Overall Reach 19,648 Awareness: Subscribers (Overall) Awareness: Increase in Subscribers Awareness: Increase in Subscribers (2013) Awareness: Subscribers (2012) Awareness: Increase in Subscribers (2012) Awareness: New Subscribers (2013 Target) Awareness: Total Impressions (Reach) Engagement: Interactions (Overall) Engagement: %Engaged FB (2012) Engagement: %Engageds TW (2012) Engagement: %Engaged LK (2012) Engagement: Avrg. Interaction Per post (2012) Engagement: Total Link Clicks (2012 N/A) Monetize: Total Leads (Overall) Monetize: % Conversion of Leads Content: Total # of Posts (2012) Content: Total # of Interactions (2012) Monetize: Total Leads (2012) Monetize: % Conversion of Leads Monetize: Total Leads (2013 Target) Monetize: Total Leads (2013 YTD) Awareness (Impressions) 2,084 33 2,125 41 2,158 27 2,167 22 2,186 24 2,202 23 2,226 40 2,245 44 2,255 23 277 - 67 100 33 55 40,000 #N/A 112 12 34 40,000 #N/A 120 8 44 40,000 #N/A 130 10 44 40,000 #N/A 140 10 33 40,000 #N/A 1,906 62 8 20 12 10 #VALUE! (1,898) (1,824) 109,957 55 2 10 40,000 29,957 #N/A 14.00% 0.03% 0.00% 150 40,000 #N/A 40,000 #N/A #N/A #N/A #N/A #N/A [1] #REF! #REF! #REF! #REF! #REF! #REF! - - - - - [2] - 3,575,000 - - - - - - - - #VALUE! #VALUE! #VALUE! #VALUE! #VALUE! #VALUE! 0.0% 0.0% 35000.0% 35000.0% 26600.0% 61600.0% #REF! 16 0 0 0 0 0 $ - 2407 0 0 0 0.0% #REF! #REF! #REF! #REF! #REF! #REF! #REF! 4 0 #REF! #REF! $200,000 0 0 0 0 0 0 0 Total by Network 4,800 6,357 10,000 10,800 15,890 - - 16 - - - - - - 27,100 19,068 1,400 28,500 36,547 900 14,181 22,242 300 15,800 20,657 596 - 16,200 57,500 300 - 20,200 72,458 724 Facebook Twitter LinkedIn YouTube Google+ Pinterest Tumblr Instagram Other Total Impressions/Reach Engagement (Interactions) Facebook Interactions Total Page Likes New Fans Unique users (fans and nonfans) Stories Created (Interactions) Post Reach People talking about This (PTAT) % Unique Users Engaged Twitter Interactions New Followers Mentions Total Interactions (fav, retweets & replies, click Followers % Engaged LinkedIn Interactions Total Followers New New Followers Interactions Clicks Total Interactions Engagement Rate YouTube Video Views Monetize (Leads) Website Traffic Twitter Mentions Articles and Blogs Campaign - Paid Media Total URL presence 147,581 255,486 4,220 4,767 - - - 17 - - - 12 - - - - - - - - - - - - - - - - - - - - TOTAL Impressions 11,157 25,890 15,583 47,585 65,959 36,723 37,053 74,000 93,382 407,332 467 10 834 485 18 2,000 496 11 3,100 482 17 9,500 496 14 506 10 532 25 5,700 550 25 6,900 552 8 YTD 5,200 220 4,200 184 18.0% 10,100 6,300 18,900 41 144 120 406 224 343 480 390 509 28 2,200 102 22.0% 2,600 7,500 308 18.0% 7,800 172 13.0% 3,000 149 19.0% 4,300 397 13.0% 6,600 297 12.0% 84 16.0% 13.0% 4 15 15 9 (3) 2 8 1 6 13 4 124 1,570 0.22% 8 8 1 4 4 - 1 - 227 1,571 0.31% 1,584 0.02% 1,545 0.00% 1,560 0.01% 1,575 0.00% 1,590 0.01% 1,587 0.01% 1,575 0.03% 95 8 - 2 2 2.1% 103 8 112 9 1 72 8 - - - 80 8 - - - 87 7 - - - 119 125 132 7 2 7 9 6 - 7 1 5 6 - 8 8 - 12 18 10 8.9% 3,781 0.0% 0.0% 0.0% 7.8% 1.5% 3,800 14.4% 3,390 58.0% 3,407 0 0 0 0 0 0 0 0 0 0 0 0 0 0 0 0 0 0 0 0 0 0 0 0 0 0 328 350 264 5 2 0 0 0 0 0 2 0 335 350 266 Total Leads % Conversion of Leads 0 0 0.0% 0.0% Content Facebook Posts Twitter Posts LinkedIn Posts YouTube 5 3 - - 13 10 2 - 44 38 8 - - 47 47 26 - 22 33 4 0 29 33 4 3 4 10 16 - Total Posts Total Interactions Avrg. Interaction Per Post 4 41 50 145 8 59 407 69 228 25 225 16 351 90 604 120 618 120 10.25 2.90 15.00 6.90 3.30 9.00 21.94 6.71 5.15 Referral Clicks Total Clicks Sig Links (Referrals) Email Clients, Apps, Direct Twitter.com Facebook.com Linkedin.com Total Clicks (including 3rd party) Total Links YTD 36 20 14 14 9 60 25 55 45 72 36 243 40 36 28 39 13 116 419
Q3 Q4 Q1 Q2 TOTALS Social Media Analytics (FY14) Total Clicks YTD 100 30 70 25 Contact Us Links Clicked New Bit.ly's created 14 18 12 46 4 6
FACEBOOK Page Impressions: The total number of times any Facebook user (fan or non fan) could have potentially se Users: The number of unique users (fans or non fans) that have seen an any content associated with your Fan: The number of impressions generated by the people that have liked your page. User Post: The number of impressions generated from user posts to your wall Page Post: The number of impressions generated from comments on your Page posts. Mention: The number of impressions generated by people who have tagged your Facebook page in a post Organic: The number of times your posts were seen in News Feeds or Tickers or on visits to your Page. Th Viral: The number of impressions generated from a story published about your Page (aka from a Page Pos Paid: The number of impressions generated from a Sponsored Story or Ad pointing to your Page. New Fans: The number of new Facebook users that have liked your Page over the duration of your report. 'Unliked' Your Page: The number of Facebook users that have unliked your Page over the duration of your Reach: The number of unique people who saw any content about that post. This will include both fans and Engaged Users: The number of people who clicked anywhere in your post without generating a story plus t Talking: The number of people who have created a story from this post. Stories are created when someone Likes: The number of people who liked this post. Comments: The number of people that commented on this post. Shares: The number of people that have shared this post. Engagement: Engagement is a ratio of engaged users to reach. As an example, a post with 4 engaged use
[1] John Joaquim: Hey Jude [2] John Joaquim: Change targets due to last few months results