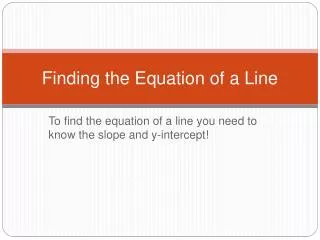
Download
1 / 24
250 likes | 538 Views
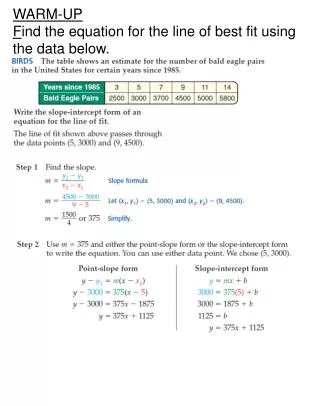
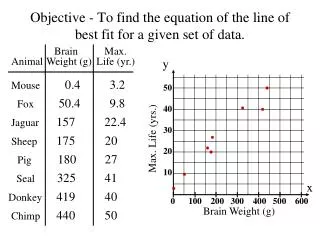
Objective - To find the equation of the line of best fit for a given set of data. Brain Weight (g). Max. Life (yr.). Animal. y. 0.4. 3.2. Mouse. 50 40 30 20 10. 50.4. 9.8. Fox. 157. 22.4. Jaguar. Max. Life (yrs.). 175. 20. Sheep. 180. 27. Pig. 325. 41. Seal. x.

E N D
Objective - To find the equation of the line of best fit for a given set of data. Brain Weight (g) Max. Life (yr.) Animal y 0.4 3.2 Mouse 50 40 30 20 10 50.4 9.8 Fox 157 22.4 Jaguar Max. Life (yrs.) 175 20 Sheep 180 27 Pig 325 41 Seal x 419 40 Donkey 0 100 200 300 400 500 600 Brain Weight (g) 440 50 Chimp
Scatterplot - a coordinate graph of data points. y 50 40 30 20 10 Trend is increasing Trend looks linear Max. Life (yrs.) Line of Best Fit -Points act like magnets attracting the line. x 0 100 200 300 400 500 600 Brain Weight (g)
Scatterplot - a coordinate graph of data points. y 50 40 30 20 10 Trend is increasing Trend looks linear Max. Life (yrs.) Line of Best Fit -Points act like magnets attracting the line. x 0 100 200 300 400 500 600 Brain Weight (g)
Scatterplot - a coordinate graph of data points. y 50 40 30 20 10 Trend is increasing Trend looks linear Max. Life (yrs.) Line of Best Fit -Points act like magnets attracting the line. x 0 100 200 300 400 500 600 Brain Weight (g)
Scatterplot - a coordinate graph of data points. y 50 40 30 20 10 Trend is increasing Trend looks linear Max. Life (yrs.) Line of Best Fit -Points act like magnets attracting the line. x 0 100 200 300 400 500 600 Brain Weight (g)
Scatterplot - a coordinate graph of data points. y 50 40 30 20 10 Trend is increasing Trend looks linear Max. Life (yrs.) Line of Best Fit -Points act like magnets attracting the line. x 0 100 200 300 400 500 600 Brain Weight (g)
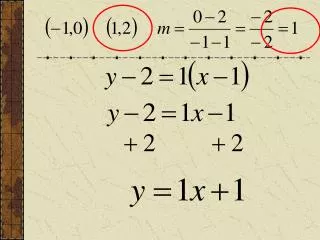
(50, 10) (450, 50) Steps y 1) Plot the points. 50 40 30 20 10 (450, 50) 2) Draw the line of best fit. 3) Take two points off the line. Max. Life (yrs.) (50, 10) x 0 100 200 300 400 500 600 Brain Weight (g)
(50, 10) (450, 50) Steps y 1) Plot the points. 50 40 30 20 10 (450, 50) 2) Draw the line of best fit. 3) Take two points off the line. Max. Life (yrs.) 4) Find the equation of the line using the two points. (50, 10) x 0 100 200 300 400 500 600 Brain Weight (g)
(50, 10) (450, 50) Steps 1) Plot the points. 2) Draw the line of best fit. 3) Take two points off the line. 4) Find the equation of the line using the two points. Actual
Scatterplots Which scatterplots below show a linear trend? a) c) e) b) d) f)
Finding the Line of Best Fit y Line of Best Fit • Ignore outliers. Outlier x
Finding the Line of Best Fit y Line of Best Fit • Ignore outliers. • Does not have to go through any points. No • Equal # of points above and below the line. x
Finding the Line of Best Fit y Line of Best Fit No • Ignore outliers. • Does not have to go through any points. • Equal # of points above and below the line. • Points attract the line like magnets to a metal rod. x
Finding the Line of Best Fit y Line of Best Fit • Ignore outliers. • Does not have to go through any points. • Equal # of points above and below the line. • Points attract the line like magnets to a metal rod. Yes x
Choosing Two Points y Chosen points are too close together. Yes x
Choosing Two Points y Chosen points have sufficient spread. Yes x
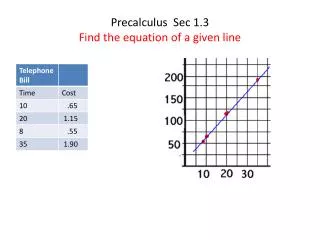
Find the equation of the line of best fit for the data below. y Sport Utility Vehicles (SUVs) Sales in U.S. 5 4 3 2 1 Year Sales (in Millions) 1991 0.9 1992 1.1 Vehicle Sales (Millions) 1993 1.4 1994 1.6 1995 1.7 1996 2.1 1997 2.4 1991 1993 1995 1997 1999 1992 1994 1996 1998 2000 x 1998 2.7 1999 3.2 Year
Find the equation of the line of best fit for the data below. (1992, 1.1) (1999, 3) y 5 4 3 2 1 Steps 1) Plot the points. 2) Draw the line of best fit. (1999, 3) Vehicle Sales (Millions) 3) Take two points off the line. (1992, 1.1) 4) Find the equation of the line using the two points. 1991 1993 1995 1997 1999 1992 1994 1996 1998 2000 x Year
Find the equation of the line of best fit for the data below. (1992, 1.1) (1999, 3) Steps 1) Plot the points. 2) Draw the line of best fit. 3) Take two points off the line. 4) Find the equation of the line using the two points. Actual
Find the equation of the line of best fit for the data below. y 5 4 3 2 1 If this trend continues, predict the sales for the year 2004. (1999, 3) Vehicle Sales (Millions) (1992, 1.1) 1991 1993 1995 1997 1999 1992 1994 1996 1998 2000 x Year
The data below shows the gold medal perform- ance in high jump in some of the past Olympics y 100 80 60 40 20 High Jump (in.) Year 1948 78 1956 83.25 1964 85.75 1972 87.75 High Jump (in.) 1980 92.75 1988 93.5 1948 1956 1964 1972 1980 1988 x Year
The data below shows the gold medal perform- ance in high jump in some of the past Olympics y (1988, 94) 100 80 60 40 20 (1948, 78) (1988, 94) (1948, 78) High Jump (in.) 1948 1956 1964 1972 1980 1988 x Year
The data below shows the gold medal perform- ance in high jump in some of the past Olympics (1948, 78) (1988, 94) Actual
The data below shows the gold medal perform- ance in high jump in some of the past Olympics y (1988, 94) 100 80 60 40 20 If this trend continues, predict the gold medal height in 2004. (1948, 78) High Jump (in.) 1948 1956 1964 1972 1980 1988 x Year