Download
1 / 6
60 likes | 189 Views
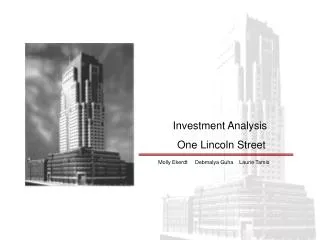
Investment Analysis One Lincoln Street. Molly Ekerdt Debmalya Guha Laurie Tamis. Introduction and overall recommendation. One Lincoln Street provides an adequate return to STRS. Project Level Returns Development Phase/Sale Upon Completion: 34.17% Operational Phase: 7.25%

E N D
Investment Analysis One Lincoln Street Molly Ekerdt Debmalya Guha Laurie Tamis
Introduction and overall recommendation One Lincoln Street provides an adequate return to STRS • Project Level Returns • Development Phase/Sale Upon Completion: 34.17% • Operational Phase: 7.25% • Both Phases: 12.75% • Splits
Key Conservative Assumptions • Rental Vacancy: We increasedrental vacancies to 10% in the four “renewal” years of 2003, 2008, 2010 and 2013 in order to both reflect the significant supply coming online in this market, and to make more conservative assumptions about the probability of vacancy in lease turnover years. • Rent Step Ups: As given, rents increased by about 2.25% in lease turnover years. We adjusted this down to 1.5% to be more conservative. • Stabilization: We used 2004 as our first stabilized year, with a full NOI. Though there is some rental income in 2003, it is still a construction year, so we assumed 2004 to be the first fully stabilized year. • Reversion: We calculated reversion using the more conservative cap rate given in the case of 7.75%, and the 2013 Net Operating Income. • Construction Loan Take Out: We assumed that the developers’ equity took out the construction loan of $174M at the end of 2003, and there was no permanent financing. Of this, the preferred partners’ contribution was $157M, which was added to their capital account balance at the end of 2003.
Risk Assumptions • For the construction phase, the discount rate is 6%, which is an addition of 50 basis points over the risk free rate. (we took the risk free rate from the 10 year Treasury Bill at 5.5%) • There is a discount rate of 7.25% for the stabilized asset. This rate is based on STRS’s knowledge of fully-leased office buildings generating initial returns of 7-7.5%. • There is a larger discount rate for the speculative asset, an additional 200 basis points spread over the stabilized asset risk, (the upper end of the common spread), to reflect the higher risk associated with this un-leased development (again, coming online along with significant competitive supply.) Thus, the discount rate associated with the speculative asset is 9.25%.
Net Present Value The NPV of the project, at Time 0, is $46,941,000. Using the canonical formula, this NPV at Time 0 is $34,000,000. If sold at Time T, the project’s value is $476,918,000 and the NPV of the speculative asset is $301,404,000.
Conclusions Though this project has a high level of risk and uncertainty, it generates far greater returns than other “core” investments that I’ve reviewed (in the 9-9.5% range). One Lincoln Street presents exactly the type of investment that STRS should have in its portfolio – providing significant investment in a Class A market with strong rental growth.