Download
1 / 21
210 likes | 350 Views
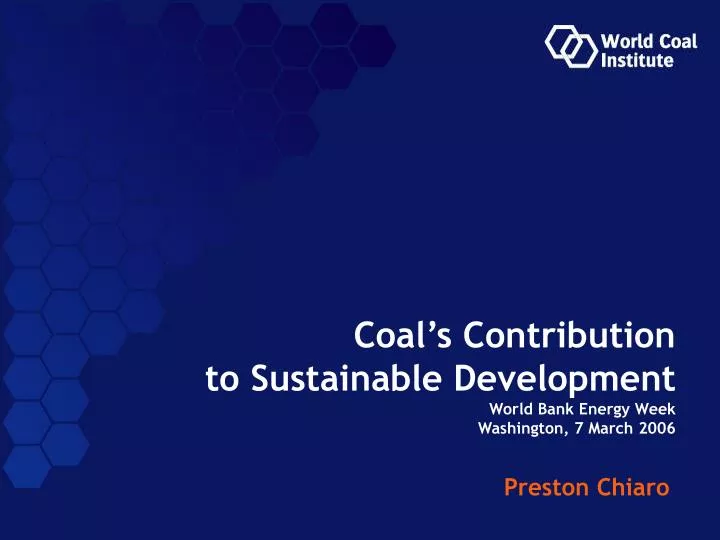
Coal’s Contribution to Sustainable Development World Bank Energy Week Washington, 7 March 2006. Preston Chiaro. WCI Corporate Members. COAL INDIA LIMITED. WCI Associate Members. plus: Shaanxi Coalfields ( PRChina ) SIECESC ( Brazil ). BAU Share in 2025.

E N D
Coal’s Contributionto Sustainable DevelopmentWorld Bank Energy WeekWashington, 7 March 2006 Preston Chiaro
WCI Corporate Members COAL INDIA LIMITED
WCI Associate Members plus: Shaanxi Coalfields (PRChina) SIECESC (Brazil)
BAU Share in 2025 World Energy Consumption by Primary Fuel 1900-2025 Nuclear- 5% Renew - 3% Gas - 26% EJ Oil - 41% Coal - 23% Growing energy demand and pressures • In 2004…. • World primary energy consumption increased by 4.3% • For the third year running, coal was the fastest growing fuel, increasing by 6.3% • 75% of that growth was supported by China 2000 World Summit on Sustainable Development 1990 Rio Summit on the Environment 1972 Stockholm Conference on the Environment Feb 2005 Kyoto Protocol entered into force 1960’s Club of Rome Limits to Growth Source: RMI analysis, IEA 2004, EIA IEO 2004, BP Statistical Review 2003/4/5, IFP
Why coal? safe affordable reliable plentiful increasingly clean 23%of world primary energy 39%of the world’s electricity is produced using coal. Main fuel for electricity in USA, Germany, China, India, South Africa, Australia, much of central Europe 70%of the world’s steel is produced using coal
A necessary role in a developing world In 2002 A world population of 6 billion and growing 1.6 billion without access to electricity 2.4 billion reliant on primitive/erratic sources • In 2030 • A world population of 7.5 billion and growing • 1.4 billion without access to electricity • 2.6 billion still reliant on primitive and erratic sources Source : WBCSD; WCI
CHINA 700 million people over past 20 years Electrification rate of 99% Serviced by a generation industry 77% dependent on coal SOUTH AFRICA Electrification rate doubled in a decade (35% to 66%) Serviced by a generation industry 90% dependent on coal Tackling energy poverty • REST OF SUB-SAHARAN AFRICA • Electrification rate of only 10% • 575 million people rely on biomass for energy
Solid Fuel Reserves World Energy Reserves 2004 (Mtoe) Russian Federation Europe North America China Middle East Other Asia/Pacific Africa South America Australia/New Zealand Coal Oil Gas Uranium* Sources: BP Statistical Review 2005; WEC Survey of Energy Resources 2001; Reasonably Assured Sources plus inferred resources to US$80/kg U 1/1/03 from OECD NEA & IAEA Uranium 2003; Resources, Production & Demand updated 2005; *energy equivalence of uranium assumed to be ~20,000 times that of coal
World primary energy consumption Nuclear- 5% Renew - 3% Gas - 26% EJ Oil - 41% Coal - 23% BAU Case Source: RMI analysis, IEA 2004, EIA IEO 2004, BP Statistical Review 2003, IFP The future • World primary energy consumption increases 60% • Two-thirds of that increase arises in developing countries • China and India account for more than two thirds of the increase in global coal use • CO2 emissions increase by 60% • Two-thirds of the increase in CO2 emissions arises in developing countries • Contribution to CO2 emissions growth attributable to oil 37%; coal 33% and gas 30% Over the next twenty years….without carbon constraining interventions….. CCS at significant scale is critical if the coal industry is to address its contribution to this burden
Carbon emissions 380 molecules of every million = CO2 In 1600’s.... ….. in 2005 280 molecules of every million = CO2 Source : Prof R H Socolow – Scientific American
Carbon emissions: the scale of the problem • Current carbon emissions of 7 Gt carbon per year and increasing • So how big is just onegigaton? OR 143millionAfrican elephants 6,200Sydney Opera Houses Source : WBCSD, Battelle, National Geographic, R H Socolow; Scientific American
What will deliver 1 Gigaton of carbon mitigation? • 700 x 1000 MW nuclear stations • Will public acceptance and the policies to support such a move be forthcoming …… recent MIMBY speculation? • 700 x 1000 MW of coal fired capacity with CCS • A key technical challenge • 300,000 x 5 MW wind turbines covering the land area of Portugal • Spatial, cost and NIMBY considerations are likely to constrain the renewables contribution The world will need all of safe & cheap nuclear, reliable &cheap renewables, and much more clean coaltogether with energy efficiency.
Can renewables deliver? Aside from questions of technology, size does matter: e.g. … the largest Wind Farm in Europe (Whinash, UK)
Can oil and gas deliver? • Similar environmental challenge to coal • Peak oil? Peak gas? • Comparisons of known reserves depletion at current depletion levels (BP Statistical Review of World Energy 2005) • OIL 41 years • GAS 67 years • COAL 164 years (some countries around 500 years)
Carbon Capture & Storage • R&D • Demonstration – Weyburn, Sleipner, Snohvit, In Salah & more. • Futuregen • CSLF • Timescales? • Costs?
Carbon Capture & Storage: is it a realistic option? • INTERGOVERNMENTAL PANEL ON CLIMATE CHANGE (IPCC) • Special Report on Carbon Capture & Storage, 2005 • No single technology option will provide all of the emissions reductions needed • Power plants with CCS could reduce CO2 emissions by 80-90% net • Applying CCS to power generation is estimated to increase costs by about US$0.01 – 0.05 per kilowatt hour • It is likely* there is a technical potential of at least 2,000 Gt CO2 storage capacity in geological formations • ocean storagecould add thousands of Gt to this capacity • In most scenarios, CCS reduces costs of stabilising CO2 concentrations by 30% or more • Will the CO2 leak?! • “Observations from engineered and natural analogues, as well as models, suggest that the fraction retained in appropriately selected and managed geological reservoirs • is very likely** to exceed 99% over 100 years, and • is likely to exceed 99% over 1,000 years.”* “Likely” is a probability between 66 and 90%. ** “Very likely” is a probability between 90 and 99%.)
Costs? International Energy Agency • US$16 trillion will be needed to meet global energy demand next 30 years • US$4 billion of that for coal-fired power generation. Princeton University (Sokolow) / Columbia University (Sachs, Lackner) • Carbon emission charges of about US$100/tC would enable commercialisation of CCS and all other necessary technologies • i.e. about US$30/tCO2 or €20/tCO2 or the October 2005 EU trading price • This equates to about 1-2% of global GNP to stabilise emissions at today's rate What role for: • Governments • Industry • Public private partnerships • Clean Development Mechanism • Asia-Pacific Partnership • Foreign direct investment
Can international policies deliver? • Kyoto Protocol on Climate Change • Clean Development Mechanism • Emissions Trading • G8 Gleneagles Plan of Action • International Energy Agency (IEA) • Carbon Sequestration Leadership Forum • Asia-Pacific Partnership for Clean Development & Climate (AP6)
Can coal deliver in the 21st century? • The 21st century needs heavy lifting power • To confront energy poverty • To fuel economic development • To maintain living standards • To enhance energy security • The 21st century needs clean power • This can be realised through carbon capture & storage • The 21st century needs COAL • safe, affordable, reliable, plentiful, and increasingly clean
Thank you www.worldcoal.org