Download
1 / 20
200 likes | 497 Views
Analyzing Trends in Science & Technology Innovation. Cody Dunne, Pengyi Zhang, Chen Huang, Jia Sun, Ben Shneiderman, Ping Wang & Yan Qu {cdunne, ben}@cs.umd.edu { pengyi , chhuang , jsun , pwang , yanqu }@umd.edu http :// stick.ischool.umd.edu

E N D
Analyzing Trends in Science & Technology Innovation Cody Dunne, Pengyi Zhang, Chen Huang, Jia Sun, Ben Shneiderman, Ping Wang & Yan Qu {cdunne, ben}@cs.umd.edu {pengyi, chhuang, jsun, pwang, yanqu}@umd.edu http://stick.ischool.umd.edu 28th Annual Human-Computer Interaction Lab Symposium May 25-26, 2011 College Park, MD
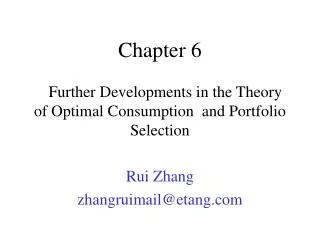
Business Intelligence 2000-20092006 Peak: Concept-Entity Co-Occurrence • Data Mining • National Security Agency • NSA • White House • FBI • AT&T • American Civil Liberties Union • Electronic Frontier Foundation • Dept. of Homeland Security • CIA Frequency Year
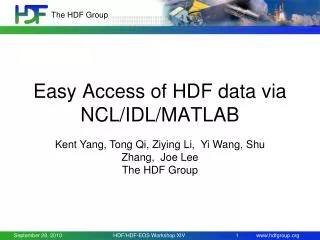
Business Intelligence 2000-2009 Matrix showing Co-Occurrence of concepts and entities
Business Intelligence 2000-2009: (subset)
Business Intelligence • 2000-2009: • Data mining • NSA • CIA • FBI • White House • Pentagon • DOD • DHS • AT&T • ACLU • EFF • Senate Judiciary Committee
Business Intelligence • 2000-2009: • Tech1 • Google • Yahoo • Stanford • Apple • Tech2 • IBM, Cognos • Microsoft • Oracle • Finance • NASDAQ • NYSE • SEC • NCR • MicroStrategy
Business Intelligence • 2000-2009: • Air Force • Army • Navy • GSA • UMD*
Business Intelligence 2000-2009 Co-Occurrence of concepts and entities (subset)
The STICK Project • NSF SciSIP Program • Science of Science & Innovation Policy • Goal: Scientific approach to science policy • The STICK Project • Science & Technology Innovation Concept Knowledge-base • Goal: Monitoring, Understanding, and Advancing the (R)Evolution of Science & Technology Innovations
STICK Contribution • Scientific, data-driven way to track innovations • Vs. current expert-based, time consuming approaches (e.g., Gartner’s Hype Cycle, tire track diagrams) • Includes both concept and product forms • Study relationships between • Study the innovation ecosystem • Organizations & people • Both those producing & using innovations
Process • Collecting • Processing • Visualizing & Analyzing • Collaborating Cleaning
Collecting Identify Concepts Data Sources News Dissertation Academic Patent Blogs • Begin with target concepts • Business Intelligence • Health IT • Cloud Computing • Customer Relationship Management • Web 2.0 • Develop 20-30 sub concepts from domain experts, wikis
Collecting (2) • Form & Expand Queries ABS( "customer relationship management" OR "customers relationship management" OR "customer relation management" ) OR TEXT(…) OR SUB(…) OR TI(…) • Scrape Results Source: http://xkcd.com/208
Processing Automatic Entity Recognition Crowd-Sourced Verification Extract most frequent 25% Assign to CrowdFlower Workers check organization names and sample sentences • BBN IdentiFinder
Processing (2) • Compute Co-Occurrence Networks • Overall edge weights • Slice by time to see network evolution • Output CSV GraphML
Visualizing & Analyzing Spotfire NodeXL CSV, Spigots, GraphML Automate feature Batch analysis & visualization Excel 2007/2010 template • Import CSV, Database • Standard charts • Multiple coordinated views • Highly scalable
Collaborating • Online Research Community • Share data, tools, results • Data & analysis downloads • Spotfire Web Player • Communication • Co-creation, co-authoring
Take Away Messages • Easier scientific, data-driven innovation analysis: • Automatic collection & processing of innovation data • Easy access to visual analytic tools for finding clusters, trends, outliers • Communities for sharing data, tools, & results
Analyzing Trends in Science & Technology Innovation Cody Dunne, Pengyi Zhang, Chen Huang, Jia Sun, Ben Shneiderman, Ping Wang & Yan Qu {cdunne, ben}@cs.umd.edu {pengyi, chhuang, jsun, pwang, yanqu}@umd.edu http://stick.ischool.umd.edu Thanks to: National Science Foundation grant SBE-0915645