Download
1 / 29
550 likes | 1.17k Views
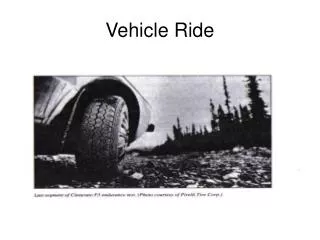
Vehicle Ride. Dynamic System & Excitations. Vehicle Excitations: Road profile & roughness Tire & wheel excitation Driveline excitation Engine excitation. V. Road Excitation.

E N D
Dynamic System & Excitations • Vehicle Excitations: • Road profile & roughness • Tire & wheel excitation • Driveline excitation • Engine excitation
V Road Excitation • Road excitation is the road profile or the road elevation along the road and includes everything from smooth roads, potholes to “kurangkan laju” • Road elevation profiles are measured using high speed profilometers Road Elevation (mm) X – distance (m)
Statistical Road Profile Gz(ν ) = G0[1+(ν0/ν)2]/(2πν)2 Where Gz(ν) = PSD amplitude (feet2/cycle/foot) = wave number (cycle/ft) G0 = roughness parameter = 1.25 x 10⁵ – rough roads = 1.25 x 10⁶ – smooth roads ν0 = cut-off wave number = 0.05 cycle/foot – asphalt road = 0.02 cycle/foot - concrete road
Tire&Wheel Assembly Excitation • Mass imbalance = m r ω2 • Tire/wheel dimensional variation • Tire radial stiffness variation
Driveline Excitation • Mass imbalance • Asymmetry of rotating parts • Shaft may be off-center on its supporting flange • Shaft may not be straight • Shaft is not rigid and may deflect
Engine Excitation • Torque output to the drive shaft from the piston engine is not uniform. It has 2 components • Steady state component • Superimposed torque variations
Ride Isolation Engine excitation Wheel/tire, Driveline excitation Road roughness excitation
Suspension Parameters M – Sprung mass, kg (body, frame, engine, transmission, etc.) m – Unsprung mass, kg (driveline, wheel assembly, chassis, etc.) Ks – Suspension stiffness, N/mm (spring stiffness) Kt - Tire Stiffness, N/mm (tire stiffness) Cs - Suspension damping, N.sec/m (damper) Z – sprung mass displacement Zu – unsprung mass displacement Zr - road elevation Fb – Force on the sprung mass (engine excitation) Fw – Force on the unsprung mass (wheel/tire or driveline excitation)
Ride Properties Ride Rate, RR = Ks*Kt/(Ks + Kt) N/mm Ride Frequency fn = √RR/M/(2*π) Hz Damped Frequency, fd = fn √1-ξ2 Hz Where ξ = damping ratio = Cs/√4KsM %
Suspension Travel Static suspension deflection = W/Ks = Mg/Ks (mm) Ride Frequency = 0.159√Ks/M Hence, Ride frequency = 0.159√g/static deflection (Hz)
Vehicle Response Equations of Motion M*Z” + Cs*Z’ + Ks*Z = Cs*Z’u + Ks*Zu + Fb --------------------- (1) m*Z”u + Cs*Z’u +(Ks+Kt)*Zu = Cs*Z’ + Ks*Z + Kt*Zr + Fw- --- (2) Dynamic Frequency Responses: Z”/Z”r = Hr(f) = (Ar + j Br)/(D + j E) ---------------------------- (3) MZ”/Fw = Hw(f) = (Aw + j Bw)/(D + j E) ----------------------- (4) MZ”/Fb = Hb(f) = (Ab + j Bb)/(D + j E) ----------------------- (5) Where j = √-1 - complex operator
Vehicle Response Ar = K1*K2 Br = K1*C*2πf Aw = K2*(2πf)2 Bw = C*(2πf)3 Ab = μ*(2πf)4 – (K1+K2)*(2πf)2 Bb = C*(2πf)3 D = μ*(2πf)4 – (K1+K2*μ+K2)* (2πf)2 + K1*K2 E = K1*C*(2πf) – (1+μ)*C*(2πf)3 And μ = m/M, C = Cs/M, K1 = Kt/M, K2 = Ks/M
Vehicle Response |H(f)|
Observations • At low frequency, gain is unity. Sprung mass moves as the road input • At about 1 Hz, sprung mass resonates on suspension with amplification • Amplitude depends on damping, 1.5 to 3 for cars, up to 5 for trucks • Above resonant frequency, response is attenuated • At 10-12 Hz, un-sprung mass goes into resonance (wheel hop) • Sprung mass response gain to wheel excitation is 0 at 0 frequency as the force on the axle is absorbed by the tire • Resonance occurs at wheel hop frequency, gain is 1 and axle force variation is directly transferred to sprung mass • Sprung mass response gain to engine excitation reaches maximum at sprung mass resonance • At higher frequencies gain becomes unity as displacements become small, suspension forces do not change and engine force is absorbed by sprung mass acceleration
Isolation of Road Acceleration Gz(f) = |Hr(f)|2*Gzr(f) Where: Gz(f) = acceleration PSD of the sprung mass H(f) = response gain for road input Gzr(f)= acceleration PSD for the road input RMS acceleration = sqrt [area under Gz(f) vs f curve]
RMS Acceleration Calculation Road profile acceleration power spectral density PSD LOG Gzr(f) = -3.523 when LOG(f) <= 0 LOG Gzr(f) = -3.523 + LOG(f) when LOG(f) >= 0 Frequency Response Function |H(f)| Sprung mass acceleration power spectral density PSD Gzs (f) = |H(f)|2 Gzr(f) RMS acceleration = area under the curve Gzr f |H(f)| f Gzs f
RMS Acceleration Calculation Step 1 : Calculate road surface PSD for each frequency from 0.1 Hz to 20 Hz Step 2 : Frequency response function for each frequency from 0.1 Hz to 20 Hz Step 3 : Calculate vehicle acceleration PSD for each frequency from 0.1 Hz to 20 Hz Step 4: Calculate area under the curve found in Step 3. Step 5: That is RMS acceleration. 99% confidence that the vehicle acceleration will not exceed 3*RMS
Suspension Stiffness Note: softer suspension reduces acceleration level Acceleration PSD
Suspension Damping Note: higher damping ratio reduces resonance peak, but increases gain at higher frequencies
Wheel Hop Resonance Wheel hop resonant frequency fa = 0.159√(Kt+Ks)/m
Bounce/Pitch Frequencies Equations of Motion Z” + αZ + βθ = 0 θ” + βZ/κ2 + γθ = 0 Where, α = (Kf+Kr)/M β = (Kr*c-Kf*b)/M γ = (Kf*b2+Kr*c2)/Mκ2 Kf = front ride rate Kr = rear ride rate b = as shown c = as shown Iy = pitch inertia κ = radius of gyration sqrt(Iy/M)
Bounce/Pitch Frequencies ω12 = (α+γ)/2 + (α-γ)2/4+ β2κ2 ω22 = (α+γ)/2 - (α-γ)2/4+ β2κ2 f1 = ω1/2π Hz f2 = ω2/2π Hz
Uncoupled Frequencies Front Ride Frequency = √Kf/M /(2π) Hz Rear Ride Frequency = √Kr/M /(2π) Hz Pitch Frequency = √Kθ/Iy /(2π) Hz Roll Frequency = √Kφ/Ix /(2π) Hz Where Kθ = (Kf*b2+Kr*c2) = pitch stiffness Kφ = (Kf+Kr)*t2/2 = roll stiffness Iy = 0.2154ML2 = pitch moment of inertia Ix = 0.1475Mt2 = roll moment of inertia t = tread width and L = wheel base
Olley’s criteria for good ride • Spring center should be at least 6.5% of the wheelbase behind C.G. • Rear ride frequency should be higher than the front • Pitch and bounce frequencies should be close to each other • Bounce frequency < 1.2 * pitch frequency • Neither frequency should be greater than 1.3 Hz • Roll frequency should be close to bounce and pitch frequencies • Avoid spring center at C.G., poor ride due to uncoupled motion • DI = κ2/bc >= 1, happens for cars with substantial overhang. Pitch frequency < bounce frequency, front ride frequency < rear ride frequency, good ride
Suspension System Design Mass, C.G. Roll Inertia Pitch Inertia Wheelbase, Tread Vehicle Road PSD RMS Acceleration RMS Susp Travel Frequencies Olley’s Criteria • Spring Rate • Tire Rate • Jounce/Rebound Clearance • Shock Rate • Unsprung Mass