Download
1 / 24
240 likes | 424 Views
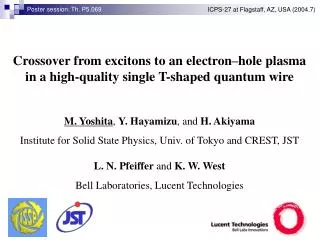
Poster session: Th. P5.069. ICPS-27 at Flagstaff, AZ, USA (2004.7). Crossover from excitons to an electron – hole plasma in a high-quality single T-shaped quantum wire. M. Yoshita , Y. Hayamizu , and H. Akiyama Institute for Solid State Physics, Univ. of Tokyo and CREST, JST.

E N D
Poster session: Th. P5.069 ICPS-27 at Flagstaff, AZ, USA (2004.7) Crossover from excitons to an electron–hole plasma in a high-quality single T-shaped quantum wire M. Yoshita, Y. Hayamizu, and H. Akiyama Institute for Solid State Physics, Univ. of Tokyo and CREST, JST L. N. Pfeiffer and K. W. West Bell Laboratories, Lucent Technologies
In this work, we studied a transition from a dilute exciton gas to a dense one-dimensional (1D) e–h system in a high-quality single T-shaped quantum wire by observing spectral evolution of photoluminescence (PL) for various excitation powers. features of 1D electron-hole systems • significant Coulomb interactions between charge carriers • importance of many-body effects ---- related to lasing mechanisms of quantum wire lasers
Introduction I The picture of the exciton Mott transition high e–h density low e–h density ( d << aB ) (aB :Bohr radius of excitons) ( d >> aB ) e–h density increase excitons a dense electron-hole plasma with band-gap renormalization in higher dimensions (3D and 2D systems) plausibly accepted 1D e–h system This picture is valid?
Introduction II Many-body effects in e-h systems of semiconductor quantum wires PL studies on high-quality quantum wires R. Ambigapathy et al. (PRL‘97) no BGR, strong excitonic correlations A. Crottini et al.(SSC’02) observation of 1D exciton molecules (bi-excitons) T. Guillet et al. (PRB’03) gradual crossover form excitons to a degenerated plasma and so on. Quantum wire lasers and lasing mechanisms E. Kapon et al. (PRL’89) first lasing from V-shaped wires W. Wegscheider et at. (PRL’93) ground-state lasing from T-shaped wires, excitonic lasing L. Sirigu et al. (PRB’00) lasing due to localized excitons J. Rubio et al. (SSC’01) coexistence of excitonic lasing with e-h plasma emission H. Akiyama et al. (PRB’03) evidence of e-h plasma lasing, not excitonic lasing and so on.
GaAs substrate Cleaved-edge overgrowth with MBE [110] [001] (001) MBE Growth In situ Cleave (110) MBE Growth 600oC 490oC by L. N. Pfeiffer et al., APL 56, 1679 (1990).
Interface control by growth interruption annealing 490oC Growth 600oC Anneal High Quality T-wire Atomically flat interfaces (by M. Yoshita et al. JJAP 2001)
A single T-shaped quantum wire single T-shaped quantum wire laser grown by cleaved edge overgrowth with MBE expanded view of T-wire region in situ anneal cleave ref: Lasing from this laser structure by Y. Hayamizu et al., APL 81, 4937 (2002).
Intensity Micro-PL images of T wire spectrally resolved PL images (uniform exc., T=5K) uniform exc. T=5K
Scanning PL spectra with point excitation scan uniform wire ・ No monolayer fluctuation > 20 mm ・ Linewidth < 1.3 meV (cf. previous T wires ~10 meV) T=5 K scan step: 0.5 mm scan length: 25 mm
Excitation power dependence of PL from T wire (T=4 K) By using micro-PL setup point excitation with a 1mm spot size excitation energy 1.6146 eV absorbed in the wire and the arm well colored lines: contributions of two components separated by lineshape analyses
Results by line-shape analyses (1) PL integrated Intensity wire PL vs. side peak
Results by line-shape analyses (2) peak position and linewidth
Spectral features of PL from the wire above 0.1 mW (high densiy regime): High • Low-energy side PL peak rapidly increase its intensity • with broadening its linewidth but no peak shift • Free-exciton PL peak gradually decreases its intensity around 10-2 mW (intermediate regime): • appearance of a new PL peak at low-energy • side of the free-exciton peak • intensity of this PL peak increases quadratically to that • of the exciton PL excitation power below 10-2 mW (low density regime): • a dominant peak from wire free excitons (1.582eV) • a tiny peak from wire localized excitons (1.580eV) • due to arm monolayer fluctuations low
Transition from excitons to a dense e-h system • Gradual crossover from the excitons to the e-h plasma • via bi-excitonic states (1) bi-exciton formation estimated e–h density (n1D) = 2.6 x 104 cm-1 (rs = 30 aB) binding energy of 3 meV (2) e-h plasma foramtion n1D = 1.7 x 105 cm-1 (rs = 4.6 aB) continuously appears at the energy position of the bi-exciton PL. • 1D e–h plasma PL shows, (1) almost symmetric emission lineshape (2) no energy shift of the peak position (3) rapid increase of linewidth with increasing e-h densities strongly Coulomb-correlated e-h plasma ( especially bi-excitonic correlations )
PL from 1D-continuum band edge low energy edges (▼) of the e-h plasma PL small PL peak at 1.589 eV (excited) from an excited state of excitons contunuous band with an onset (onset) due to higher excited-state PL and 1D continuum states
Band edges of the excitons and e-h plasma • The exciton continuum band edges (△) stay at the same • energy position even at high e–h densities. • The low-energy edges of the plasma PL (▼) • (1) show red-shift with increasing e-h densities possibly due to BGR effects, while the peak positions show no energy shift, • appears at the energy position of the bi-excitons, • not that of the excitons, • therefore, • (3) do not continuously connect to the exciton band edges. • These two band edges seems to coexist at an intermediate • density regime,
Physical picture of 1D exciton–plasma transition the exciton Mott transition Our results shows • no energy shift of the exciton band edge Increase of e-h pair density causes ・ red shift of the band edge (band-gap renormalization (BGR)) ・ reduction of exciton binding energy • plasma low-energy edges show BGR, but appear at the energy positions of the bi-excitons not that of the excitoons eg. D. W. Wang and S. Das Sarma, PRB 64, 195313 (2001). • no level-crossing between two band edges band edge • instead, coexistence of two band edges exciton level ↓ Need for a new physical picture which describes many-body effects in 1D e-h system.
Conclusions We observed the evolution of PL from the single T wire with high uniformity to study many-body effects in 1D e–h systems. 1. The transition from excitons to an e–h plasma was a gradual crossover via bi-excitonic states. 2. The e–h plasma shows strong Coulomb correrations – bi-excitonic correrations – in the 1D e–h system. 3. In contrast to a prevailing theories, the low-energy edge of the e–h plasma never crosses the continuum band edges of the 1D excitons. There results are not explained by a picture of the exciton Mott transition. ---- A new picture is required!
Recent theoretical work by K. Asano and T. Ogawa (Osaka Univ.) 1D e-h systems • using the Tomonaga-Luttinger model, • bosonization method • linear band dispersion • including long-range Coulomb interaction (1/r) The result says : existence of a finite gap at the absolute zero temperature ---- no Mott transition the correlation function for the bi-exciton density shows the slowest decay against increased spatial distance ---- strong bi-excitonic correlations acts as it were a “Biexciton Liquid”
related presentation in ICPS 27 “Optical gain and absorption spectra due to a one-dimensional electron-hole plasma in quantum wire lasers” by Hayamizu et al. R4.003 Friday morning, July 30 Thank you!
PLspectrum Line-shape fitting Excitation power dependence of PL spectra (T= 5 and 60 K) Exc.: cw Ti:Sa laser (hn=1.615 eV) side peak exciton e-h plasma appears n1D ~ 1.7x105 cm-1 電子正孔密度 bi-excitons appear n1D ~ 2.6x104 cm-1 free-exciton + localized
sat. pl. bi-ex. : 1.2×106 cm-1 : 1.7×10⁵ : 2.6×10⁴ excitation power dependence of PL peak position and linewidth peak position PL linewidth e-h pair density
高温での発光スペクトル励起強度依存性 高温 T=60K (> 励起子分子束縛エネルギー(~3 meV))における 励起子から高密度電子正孔状態への移り変わり 1. e-h密度 < 1×104 cm-1 ・ 励起子発光 --- 発光線幅は低温とほぼ同じ。 2. e-h密度 1×104 cm-1付近 ・ 励起子発光の約2.7 meV低エネルギー側に 新たな発光帯の出現。 cf. 低温(5K) 励起子分子形成領域では、 線幅ほぼ一定 ・ 発光線幅は徐々に増加 電子正孔プラズマ形成? 高温でも励起子分子の相関を持つ? 3. e-h密度 > 1×104 cm-1 ・ 低温と比較し発光スペクトルの高エネルギー側裾が広がる。 ・ プラズマ発光線幅と共に励起子発光線幅も増加?