Renewable energy
290 likes | 502 Views
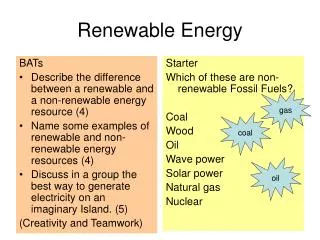
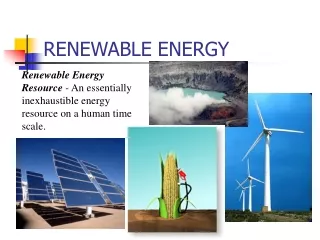
Renewable energy. Sun Wind Hydro Wave Tidal Osmosis Geo thermal Biofuel. Renewable energy sources. World Marketed Energy Consumption. ENERGY PRODUCTION IN THE WORLD 1860 - 1997. 8000. Hydro Nuclear Natural gas Oil Coal Bio mass. 6000. Energy [mill. Tons oil eq. per year].

Renewable energy
E N D
Presentation Transcript
Sun Wind Hydro Wave Tidal Osmosis Geo thermal Biofuel Renewable energy sources
ENERGY PRODUCTION IN THE WORLD 1860 - 1997 8000 Hydro Nuclear Natural gas Oil Coal Bio mass 6000 Energy [mill. Tons oil eq. per year] 4000 2000 1860 1880 1900 1920 1940 1960 1980
Predicted Power Generation from Other RenewablesWorld - Reference and Alternative Policy Scenario TWh Source: IEA 2006
EU - Predicted Power Generation Reference and Alternative Policy Scenario TWh Reference Scenario 2030 Alternative Policy Scenario 2030 2004 O. Ren. = Other Renewables Sum: Ref. 4304 TWh Alt. 3681 TWh Sum: 2004: 3155 TWh Source: IEA 2006
EU - Predicted Power Generation from Other RenewablesReference and Alternative Policy Scenario TWh Source: IEA 2006
Source: http://marine.rutgers.edu/mrs/education/class/yuri/erb.html Annual incoming solar energy: 54385•1020 J
Sun energy potential Source: www.worldenergy.org
Wind power and energy A • Power output from wind turbines: • Energy production from wind turbines: C
The world’s energy potential for land based wind turbines Estimated energy output in kWh/kW from a wind turbine that are dimensioned for 11 m/s
Installed wind power Source: www.gwec.net
Total electricity production: 18 184 TWh/year (2005) Hydro : 19 % Nuclear : 16 % Coal: 40 % Natural Gas: 15 % Oil: 10 % Norway: 99% energy production from hydro power with an installed power of 28 000 MW Total electricity production in the world source: www.bp.com/statisticalreview
Energy production : 2 650 TWh/year Installed capacity: 715 000 MW Hydro power in the world Hydro power potential in the world • Total potential: 40 000 TWh/year • Technical potential: 14 400 TWh/year • Economical and technical potential : 8 900 TWh/year source: http://en.wikipedia.org, www.worldenergy.org
24 30 40 49 30 67 70 89 50 53 41 68 92 102 22 60 50 11 13 40 100 30 40 13 10 72 26 13 19 14 43 15 50 3 10 8 19 20 12 8 12 17 18 13 14 11 18 20 12 17 10 20 11 34 16 12 21 27 9 15 41 20 30 34 24 43 23 40 17 33 37 40 25 40 48 40 60 50 66 24 50 84 82 33 81 74 29 100 72 42 97 Wave power potentialThe numbers denotes power per meter wave front [kW/m]
Power potential from waves [kW/m] Group Velocity cg a
Energy potential in the tidal currents EC 105 TWh • UK 50 TWh • France 40 TWh World?
Energy potential in the tidal currents Source: www.worldenergy.org/wec-geis/publications/reports/ser/tide/tide.asp
Saltkraft Prinsippet ved saltkraftverk kalles trykkretardert osmose (TRO) og går ut på å utnytte energien som frigjøres når salt og ferskvann blandes. Dette skjer ved at de tilføres i hvert sitt kammer i et kar adskilt av en membran (se fig). Membranen tillater gjennomstrømning av ferskvann, men ikke saltvann. Det ferske vannet vil da strømme gjennom til den andre siden, og energien i denne strømmen kan tappes ved hjelp av en turbin. Det er det osmotiske trykket mellom ferskvann og saltvann som sørger for at det opprettholdes en strømning gjennom membranen. Det osmotiske trykket er maksimalt 27 bar. Norges energi potensial er 50 TWh Kilde: www.sintef.no
Geothermal energy The estimated amount of total heat flowing from the Earth's interior is equivalent to 42 terawatts
Energy 38 TWh electricity production 34 TWh heat production Installed power: 8.912 MW for electricity production 16.000 MW for heat production Geothermal energy in the world • Source: • Renewable energy (Renew. energy) ISSN 0960-1481 • http://iga.igg.cnr.it/geo/
Thermochemical Conversion Technolgies Pyrolysis Gasification Combustion Charcoal Bio-oil Combustible gas Heat Barbeque Gas-turbine Boiler Woodstove Motor Metalurgical industry Motor Generator District heating Steam-turbine Fuel Electricity
Theoretical energy potential in Norway: 415 TWh Technical energy potential in Norway: 35 TWh Energy production from bio fuel in Norway today: 7,5 TWh in private homes 7,5 TWh in the industry Bio Fuel in Norway