ZoomCharts Sees Global Recognition
40 likes | 168 Views
ZoomCharts is enjoying international recognition, with impressed users as far reaching as countries such as Thailand. An increasing number of professionals in the world of business, technology, government, education, and more are discovering ZoomCharts, the world’s most interactive data visualization software, with completely interactive charts and graphs that support massive amounts of data, can be used with all modern touchscreen devices, and perform at incredibly fast speeds. Thailand’s Next Flow, a group of creative technology experts, recommends ZoomCharts. Next Flow specializes in training users to save time by using technology most efficiently and effectively. And they use best tools that help them to achieve these goals of working faster and smarter. Satisfied users of the software themselves, Next Flow dubs ZoomCharts tools to be among the best in the data visualization market. In a world where interactive HTML data visualization tools are widely available, they name it one of the most powerful, and visual providers. Check out Next Flow at http://nextflow.in.th Check out ZoomCharts products: Network Chart Big network exploration Explore linked data sets. Highlight relevant data with dynamic filters and visual styles. Incremental data loading. Exploration with focus nodes. Time Chart Time navigation and exploration tool Browse activity logs, select time ranges. Multiple data series and value axes. Switch between time units. Pie Chart Amazingly intuitive hierarchical data exploration Get quick overview of your data and drill down when necessary. All in a single easy to use chart. Facet Chart Scrollable bar chart with drill-down Compare values side by side and provide easy access to the long tail. ZoomCharts http://www.zoomcharts.com The world’s most interactive data visualization software

ZoomCharts Sees Global Recognition
E N D
Presentation Transcript
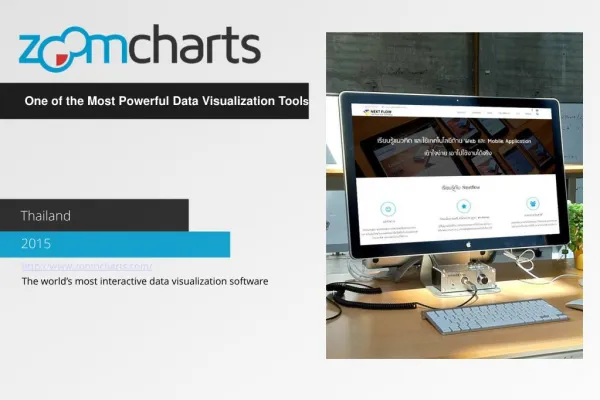
One of the Most Powerful Data Visualization Tools Thailand 2015 http://www.zoomcharts.com/ The world’s most interactive data visualization software
ZoomCharts Sees Global Recognition as One of the Most Powerful Data Visualization Tools ZoomCharts is enjoying international recognition, with impressed users as far reaching as countries such as Thailand. An increasing number of professionals in the world of business, technology, government, education, and more are discovering ZoomCharts, the world’s most interactive data visualization software, with completely interactive charts and graphs that support massive amounts of data, can be used with all modern touchscreen devices, and perform at incredibly fast speeds. Thailand’s Next Flow, a group of creative technology experts, recommends ZoomCharts. Next Flow specializes in training users to save time by using technology most efficiently and effectively. And they use best tools that help them to achieve these goals of working faster and smarter. Satisfied users of the software themselves, Next Flow dubs ZoomCharts tools to be among the best in the data visualization market. In a world where interactive HTML data visualization tools are widely available, they name it one of the most powerful, and visual providers. Check out Next Flow at http://nextflow.in.th
ZoomCharts Sees Global Recognition as One of the Most Powerful Data Visualization Tools
Check out ZoomCharts products: Network Chart Big network exploration Explore linked data sets. Highlight relevant data with dynamic filters and visual styles. Incremental data loading. Exploration with focus nodes. Time Chart Time navigation and exploration tool Browse activity logs, select time ranges. Multiple data series and value axes. Switch between time units. Pie Chart Amazingly intuitive hierarchical data exploration Get quick overview of your data and drill down when necessary. All in a single easy to use chart. Facet Chart Scrollable bar chart with drill-down Compare values side by side and provide easy access to the long tail. ZoomCharts http://www.zoomcharts.com/ The world’s most interactive data visualization software