Download
1 / 5
50 likes | 178 Views
ZoomCharts is offering data visualization tools to support speakers at the WebVisions NYC conference, taking place April 2nd, 2015 at Projective Space, 72 Allen Street, 3rd floor, New York, NY 10002. Check out what you can do with ZoomCharts charts and graphs at http://zoomcharts.com ZoomCharts offers the world’s most interactive data visualization software. All charts and graphs are completely interactive, support massive data sets, can be used on all modern, touchscreen devices, and perform at incredibly fast speeds. Be among the growing number of professionals discovering the exciting potential that ZoomCharts has in improving the efficiency of data presentation. WebVisions events are creative web conferences that explore the happiness of design, coding, UX, and content strategy, and show how hacking happiness can change organizations, communities, and the world. These events are held throughout the year on an international scale, taking place in New York City, Portland, Barcelona, Chicago, and Berlin. Whether you are a designer or a developer, you will get the unique opportunity to explore the future of design and content creation in an event that promotes learning, collaboration, and entrepreneurism, and which has been inspiring industry members since 2001. Featured speakers at WebVisions NYC include Yoni Bloch, founder and CEO of Interlude, an interactive video design, development, and marketing tech company; Donna Lichaw, an expert in strategic storytelling, design, and development, who has worked with businesses such as Citi, Atlantic Records, and Apartment Therapy; Chris Pallé, founder of Wisdom Craft, with over 18 years of strategic, creative, and analytical UX experience; Mona Patel, founder of Motivate Design and teacher of design research and strategy at Parsons The New School for Design; Clarissa Peterson, UX designer, web developer, and co-founder of Peterson/Kandy, a digital agency that specializes in responsive web design; and Paul Trani,

E N D
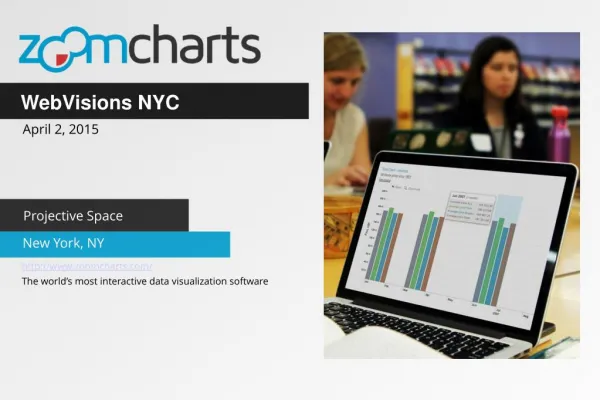
WebVisions NYC April 2, 2015 Projective Space New York, NY http://www.zoomcharts.com/ The world’s most interactive data visualization software
WebVisions NYC April 2, 2015 • ZoomCharts is offering data visualization tools to support speakers at the WebVisions NYC conference, taking place April 2nd, 2015 at Projective Space, 72 Allen Street, 3rd floor, New York, NY 10002. • Check out what you can do with ZoomCharts charts and graphs at http://zoomcharts.com • ZoomCharts offers the world’s most interactive data visualization software. All charts and graphs are completely interactive, support massive data sets, can be used on all modern, touchscreen devices, and perform at incredibly fast speeds. Be among the growing number of professionals discovering the exciting potential that ZoomCharts has in improving the efficiency of data presentation. • WebVisions events are creative web conferences that explore the happiness of design, coding, UX, and content strategy, and show how hacking happiness can change organizations, communities, and the world. These events are held throughout the year on an international scale, taking place in New York City, Portland, Barcelona, Chicago, and Berlin.
WebVisions NYC April 2, 2015 • Whether you are a designer or a developer, you will get the unique opportunity to explore the future of design and content creation in an event that promotes learning, collaboration, and entrepreneurism, and which has been inspiring industry members since 2001. • Featured speakers at WebVisions NYC include Yoni Bloch, founder and CEO of Interlude, an interactive video design, development, and marketing tech company; • Donna Lichaw, an expert in strategic storytelling, design, and development, who has worked with businesses such as Citi, Atlantic Records, and Apartment Therapy; Chris Pallé, founder of Wisdom + Craft, with over 18 years of strategic, creative, and analytical UX experience; Mona Patel, founder of Motivate Design and teacher of design research and strategy at Parsons The New School for Design; Clarissa Peterson, UX designer, web developer, and co-founder of Peterson/Kandy, a digital agency that specializes in responsive web design; and Paul Trani, an Adobe Certified Instructor and content producer who uses HTML5 to create award winning content for desktop and mobile. • Sponsors of this exciting event include Adobe, Mad*Pow, Hot Pepper Studios, brytCAST, Rosenfeld Media, and Sticker Mule.
WebVisions NYC April 2, 2015
Check out ZoomCharts products: Network Chart Big network exploration Explore linked data sets. Highlight relevant data with dynamic filters and visual styles. Incremental data loading. Exploration with focus nodes. Time Chart Time navigation and exploration tool Browse activity logs, select time ranges. Multiple data series and value axes. Switch between time units. Pie Chart Amazingly intuitive hierarchical data exploration Get quick overview of your data and drill down when necessary. All in a single easy to use chart. Facet Chart Scrollable bar chart with drill-down Compare values side by side and provide easy access to the long tail. ZoomCharts http://www.zoomcharts.com/ The world’s most interactive data visualization software