Download
1 / 5
50 likes | 176 Views
ZoomCharts is offering data visualization tools to support presenters at the 3rd International Conference on Emerging Trends and Research in Engineering and Technology, taking place April 6th to 7th at the IBSS College of Engineering, Mardi Road, Amravati, Maharashtra, India 444602. Check out what you can do with ZoomCharts charts and graphs at http://zoomcharts.com ZoomCharts is a leading data visualization provider that offers the world’s most interactive data visualization software. All charts and graphs are completely interactive, support big data sets, and can be used on all modern devices, including touch screens, with incredibly fast performance. Be among the growing number of professionals discovering the exciting potential that ZoomCharts has in improving the efficiency of data analysis and presentation. Organized by the IBSS College of Engineering, and in association with the International Journal of Pure & Applied Research in Engineering & Technology, the conference’s aim is to provide an interdisciplinary forum for teachers, engineers, researchers, students, and technology experts to discuss and promote research and advances in engineering and technology. The conference aims to provide a free flow of ideas, and hopes to promote research and development activities among researchers, engineers, students, and practitioners working in India and around the world. Those participating in the event include faculty, undergraduate and postgraduate students, industry members, and research scholars. A wide range of themes will be covered at the conference. These include civil engineering topics, such as structural engineering, environmental engineering, civil engineering materials, construction engineering, transportation engineering, geotechnical engineering and geology, architecture & urban planning, and computer simulation and CAD/CAE; electronics engineering topics such VLSI and embedded systems, nano-technology, wireless communication.

E N D
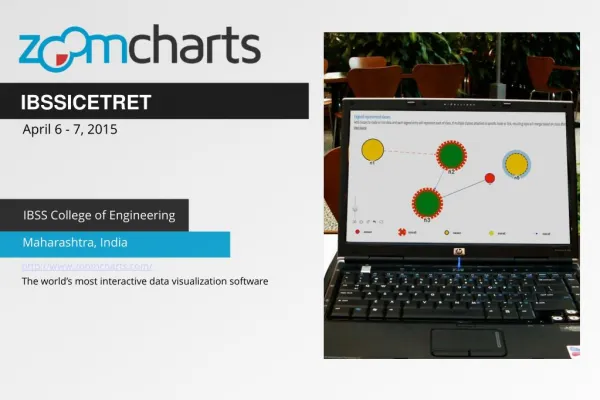
IBSSICETRET April 6 - 7, 2015 IBSS College of Engineering Maharashtra, India http://www.zoomcharts.com/ The world’s most interactive data visualization software
ZoomCharts For IBSSICETRET April 6 - 7, 2015 ZoomCharts is offering data visualization tools to support presenters at the 3rd International Conference on Emerging Trends and Research in Engineering and Technology, taking place April 6th to 7th at the IBSS College of Engineering, Mardi Road, Amravati, Maharashtra, India 444602. Check out what you can do with ZoomCharts charts and graphs at http://zoomcharts.com ZoomCharts is a leading data visualization provider that offers the world’s most interactive data visualization software. All charts and graphs are completely interactive, support big data sets, and can be used on all modern devices, including touch screens, with incredibly fast performance. Be among the growing number of professionals discovering the exciting potential that ZoomCharts has in improving the efficiency of data analysis and presentation. Organized by the IBSS College of Engineering, and in association with the International Journal of Pure & Applied Research in Engineering & Technology, the conference’s aim is to provide an interdisciplinary forum for teachers, engineers, researchers, students, and technology experts to discuss and promote research and advances in engineering and technology. The conference aims to provide a free flow of ideas, and hopes to promote research and development activities among researchers, engineers, students, and practitioners working in India and around the world. Those participating in the event include faculty, undergraduate and postgraduate students, industry members, and research scholars.
ZoomCharts For IBSSICETRET April 6 - 7, 2015 ZA wide range of themes will be covered at the conference. These include civil engineering topics, such as structural engineering, environmental engineering, civil engineering materials, construction engineering, transportation engineering, geotechnical engineering and geology, architecture & urban planning, and computer simulation and CAD/CAE; electronics engineering topics such VLSI and embedded systems, nano-technology, wireless communication, digital image and signal processing, signal and image processing, digital communication, electronics and circuits design, control systems, fiber optics, biomedical engineering and technology, microprocessors and microcontrollers, and satellite and radar communication; computer engineering and IT topics such as networking and network security, advanced distributed database management systems, open source technologies, cryptography, stenography and network securities, parallel and distributed computing systems, reliability engineering, cloud computing and soft computing, object oriented software engineering and web engineering, data warehousing and mining, artificial intelligence, advanced computer architecture, mobile computing, and computer graphics; and mechanical engineering topics such as CAD/CAM, thermal engineering, production engineering, metallurgical engineering, mechatronics/MEMS/NEMS, robotics and automation, and automobile engineering.
ZoomCharts For IBSSICETRET April 6 - 7, 2015
Check out ZoomCharts products: Network Chart Big network exploration Explore linked data sets. Highlight relevant data with dynamic filters and visual styles. Incremental data loading. Exploration with focus nodes. Time Chart Time navigation and exploration tool Browse activity logs, select time ranges. Multiple data series and value axes. Switch between time units. Pie Chart Amazingly intuitive hierarchical data exploration Get quick overview of your data and drill down when necessary. All in a single easy to use chart. Facet Chart Scrollable bar chart with drill-down Compare values side by side and provide easy access to the long tail. ZoomCharts http://www.zoomcharts.com/ The world’s most interactive data visualization software