Download
1 / 5
50 likes | 127 Views
ZoomCharts is offering data visualization tools to support presenters at the Fluent conference, taking place April 20th through 22nd at the San Francisco Marriott Marquis, 780 Mission Street, San Francisco, CA 94103. Check out what you can do with ZoomCharts charts and graphs at http://zoomcharts.com ZoomCharts is a leading data visualization provider, offering the world’s most interactive data visualization software. ZoomCharts provides fully interactive charts that support large data inputs, can be used on any modern device, and perform at incredibly fast speeds. Be among the growing number of professionals discovering the exciting potential that ZoomCharts has in improving the efficiency of data analysis and presentation. The Fluent web conference spans three days of exciting training and tutorials, and keynotes and sessions, made for developers working with JavaScript, HTML5, CSS3, WebGL, Node.js, and other Web technologies. It provides an excellent learning opportunity for building web applications, designing for mobile devices, and working with the always evolving technologies that drive the Web platform. The event brings together UX/UI designers, developers working in Web and mobile, software engineers, and thousands of others who work with major and emerging Web technologies, and gives them an opportunity to network, connect, and join in discussions with other members of the community. This popular conference includes sponsors such as IBM, SAP, and Mandrill, among many others. Guest speakers include: Marcy Sutton, Developer at Substantial, who will be giving a talk on Accessibility in AngularJS and Beyond; Divya Manian, Project Manager at Adobe, who will be speaking on Bridging the Gap Between Designers and Developers; Andreas Gal, CTO of Mozilla, giving a session on Dirty Performance Secrets of HTML5; Paul Irish, Chrome Developer Advocate at Google, who will be speaking on How Users Perceive the Speed of the Web.

E N D
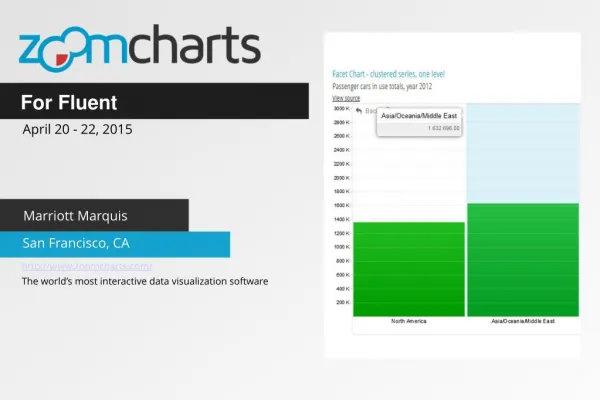
For Fluent April 20 - 22, 2015 Marriott Marquis San Francisco, CA http://www.zoomcharts.com/ The world’s most interactive data visualization software
ZoomCharts For Fluent April 20 - 22, 2015 ZoomCharts is offering data visualization tools to support presenters at the Fluent conference, taking place April 20th through 22nd at the San Francisco Marriott Marquis, 780 Mission Street, San Francisco, CA 94103. Check out what you can do with ZoomCharts charts and graphs at http://zoomcharts.com ZoomCharts is a leading data visualization provider, offering the world’s most interactive data visualization software. ZoomCharts provides fully interactive charts that support large data inputs, can be used on any modern device, and perform at incredibly fast speeds. Be among the growing number of professionals discovering the exciting potential that ZoomCharts has in improving the efficiency of data analysis and presentation. The Fluent web conference spans three days of exciting training and tutorials, and keynotes and sessions, made for developers working with JavaScript, HTML5, CSS3, WebGL, Node.js, and other Web technologies. It provides an excellent learning opportunity for building web applications, designing for mobile devices, and working with the always evolving technologies that drive the Web platform.
ZoomCharts For Fluent April 20 - 22, 2015 The event brings together UX/UI designers, developers working in Web and mobile, software engineers, and thousands of others who work with major and emerging Web technologies, and gives them an opportunity to network, connect, and join in discussions with other members of the community. This popular conference includes sponsors such as IBM, SAP, and Mandrill, among many others. Guest speakers include: Marcy Sutton, Developer at Substantial, who will be giving a talk on Accessibility in AngularJS and Beyond; Divya Manian, Project Manager at Adobe, who will be speaking on Bridging the Gap Between Designers and Developers; Andreas Gal, CTO of Mozilla, giving a session on Dirty Performance Secrets of HTML5; Paul Irish, Chrome Developer Advocate at Google, who will be speaking on How Users Perceive the Speed of the Web; Axel Rauschmayer, Founder of Ecmanauten, who will be giving a session on ECMAScript 6 in Theory and Practice; and many, many more.
ZoomCharts For Fluent April 20 - 22, 2015
Check out ZoomCharts products: Network Chart Big network exploration Explore linked data sets. Highlight relevant data with dynamic filters and visual styles. Incremental data loading. Exploration with focus nodes. Time Chart Time navigation and exploration tool Browse activity logs, select time ranges. Multiple data series and value axes. Switch between time units. Pie Chart Amazingly intuitive hierarchical data exploration Get quick overview of your data and drill down when necessary. All in a single easy to use chart. Facet Chart Scrollable bar chart with drill-down Compare values side by side and provide easy access to the long tail. ZoomCharts http://www.zoomcharts.com/ The world’s most interactive data visualization software