Download
1 / 5
50 likes | 223 Views
ZoomCharts is offering data visualization tools to support speakers at the Probability Theory and Combinatorial Optimization conference held by Duke University’s Fuqua School of Business, taking place March 14th to 15th, 2015 in Durham, North Carolina, 27708. Check out what you can do with ZoomCharts charts and graphs at http://zoomcharts.com ZoomCharts, the world’s most interactive data visualization software, allows you to create fully interactive, visually appealing representations of big data sets on all modern devices and at incredibly fast speeds. ZoomCharts tools are being discovered by a growing number of clients in a variety of fields as the best way to analyze and present data. Don’t be among the last to discover the exciting potential that ZoomCharts tools can open up for your data. The Probability Theory and Combinatorial Optimization conference will take place on Pi Day (3/14), and will also provide an opportunity to celebrate J. Michael Steele’s contributions to probability theory and combinatorial optimization in honor of his 65th birthday. Speakers from prestigious schools are being invited to speak at the conference, including educators from the University of California, Stanford University, McGill University, John Hopkins University, the Massachusetts Institute of Technology, Pompeu Fabra University, the University of Pennsylvania, and Lehigh University. Sponsors of the event include the National Science Foundation, the Institute of Mathematical Statistics, the Fuqua School of Business at Duke University, and the Wharton School at the University of Pennsylvania. ZoomCharts http://www.zoomcharts.com The world’s most interactive data visualization software

E N D
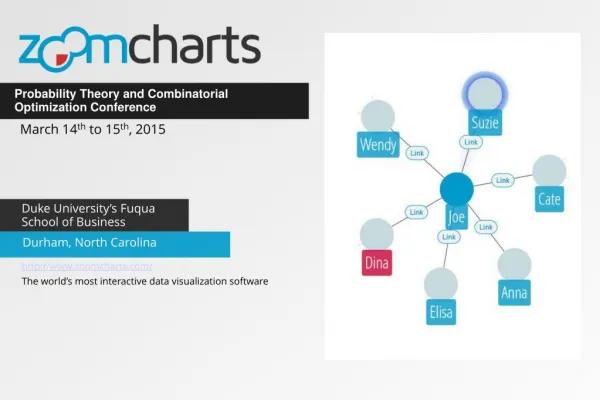
Probability Theory and Combinatorial • Optimization Conference March 14th to 15th, 2015 Duke University’s Fuqua School of Business Durham, North Carolina http://www.zoomcharts.com/ The world’s most interactive data visualization software
ZoomCharts For Probability Theory and Combinatorial Optimization Conference • March 14-15, 2015 • ZoomCharts is offering data visualization tools to support speakers at the Probability Theory and Combinatorial Optimization conference held by Duke University’s Fuqua School of Business, taking place March 14th to 15th, 2015 in Durham, North Carolina, 27708. • Check out what you can do with ZoomCharts charts and graphs at http://zoomcharts.com • ZoomCharts, the world’s most interactive data visualization software, allows you to create fully interactive, visually appealing representations of big data sets on all modern devices and at incredibly fast speeds. ZoomCharts tools are being discovered by a growing number of clients in a variety of fields as the best way to analyze and present data. Don’t be among the last to discover the exciting potential that ZoomCharts tools can open up for your data.
ZoomCharts For Probability Theory and Combinatorial Optimization Conference • March 14-15, 2015 • The Probability Theory and Combinatorial Optimization conference will take place on Pi Day (3/14), and will also provide an opportunity to celebrate J. Michael Steele’s contributions to probability theory and combinatorial optimization in honor of his 65th birthday. • Speakers from prestigious schools are being invited to speak at the conference, including educators from the University of California, Stanford University, McGill University, John Hopkins University, the Massachusetts Institute of Technology, Pompeu Fabra University, the University of Pennsylvania, and Lehigh University. • Sponsors of the event include the National Science Foundation, the Institute of Mathematical Statistics, the Fuqua School of Business at Duke University, and the Wharton School at the University of Pennsylvania.
ZoomCharts For Probability Theory and Combinatorial Optimization Conference • March 14-15, 2015
Check out ZoomCharts products: Network Chart Big network exploration Explore linked data sets. Highlight relevant data with dynamic filters and visual styles. Incremental data loading. Exploration with focus nodes. Time Chart Time navigation and exploration tool Browse activity logs, select time ranges. Multiple data series and value axes. Switch between time units. Pie Chart Amazingly intuitive hierarchical data exploration Get quick overview of your data and drill down when necessary. All in a single easy to use chart. Facet Chart Scrollable bar chart with drill-down Compare values side by side and provide easy access to the long tail. ZoomCharts http://www.zoomcharts.com/ The world’s most interactive data visualization software