Download
1 / 5
50 likes | 150 Views
ZoomCharts is offering data visualization tools to support speakers at Agile India 2015, taking place March 23rd to March 30th, 2015, at the Chancery Pavilion, No. 135 Residency Road, Bangalore 560025, India. Check out what you can do with ZoomCharts charts and graphs at http://zoomcharts.com ZoomCharts is the world’s most interactive data visualization software. Create fully interactive, stunning visual representations of big data sets on modern devices at incredibly fast speeds. Be among the growing number of clients in a variety of professions discovering the exciting potential that ZoomCharts tools opens up for analyzing and presenting data. The Agile India conference offers an opportunity for agile method enthusiasts to learn, share ideas, and network with other members of the agile community. The conference is aimed to provide a rich experience for attendees, focusing on building a sustainable community that favors quality over quantity, with the intent of providing an equal opportunity for conference presenters. Agile India is presented by the Agile Software Community of India (ASCI), a registered society of Agile Software Development practitioners. Part of the event features pre and post conference workshops given by international speakers, including Coaching for “Best Fit” Agile: Applying the Agile Fluency Model by Diana Larsen, MicroServices: Let’s Build Some! By Fred George, Disciplined Agile Delivery in a Nutshell by Mark Lines, Understanding and Implementing DevOps Flow by Yuval Yeret, Suceeding with BDD by Aslak Hellesoy, and Passionate ProductOwner (SCPO) by Jeff Patton. Previous Agile India conferences have been extremely successful, having held thousands of attendees from dozens of countries all over the world, such as India, Sri Lanka, Singapore, Malaysia, Australia, the United States, the United Kingdom, China, and many more. ZoomCharts http://www.zoomcharts.com The world’s most interactive data visualization software

E N D
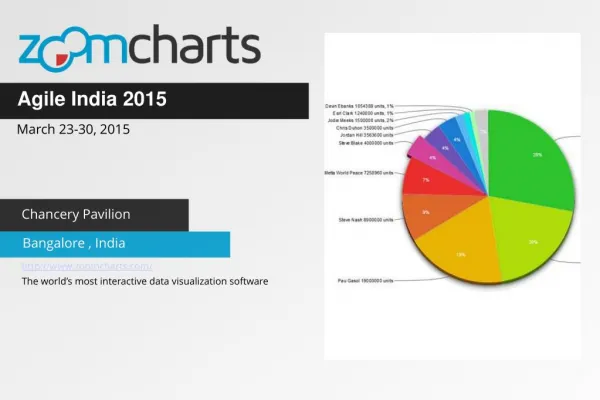
Agile India 2015 March 23-30, 2015 Chancery Pavilion Bangalore , India http://www.zoomcharts.com/ The world’s most interactive data visualization software
ZoomCharts For Agile India 2015 March 23-30, 2015 ZoomCharts is offering data visualization tools to support speakers at Agile India 2015, taking place March 23rd to March 30th, 2015, at the Chancery Pavilion, No. 135 Residency Road, Bangalore 560025, India. Check out what you can do with ZoomCharts charts and graphs at http://zoomcharts.com ZoomCharts is the world’s most interactive data visualization software. Create fully interactive, stunning visual representations of big data sets on modern devices at incredibly fast speeds. Be among the growing number of clients in a variety of professions discovering the exciting potential that ZoomCharts tools opens up for analyzing and presenting data. The Agile India conference offers an opportunity for agile method enthusiasts to learn, share ideas, and network with other members of the agile community. The conference is aimed to provide a rich experience for attendees, focusing on building a sustainable community that favors quality over quantity, with the intent of providing an equal opportunity for conference presenters.
ZoomCharts For Agile India 2015 March 23-30, 2015 Agile India is presented by the Agile Software Community of India (ASCI), a registered society of Agile Software Development practitioners. Part of the event features pre and post conference workshops given by international speakers, including Coaching for “Best Fit” Agile: Applying the Agile Fluency Model by Diana Larsen, MicroServices: Let’s Build Some! By Fred George, Disciplined Agile Delivery in a Nutshell by Mark Lines, Understanding and Implementing DevOps Flow by Yuval Yeret, Suceeding with BDD by Aslak Hellesoy, and Passionate ProductOwner (SCPO) by Jeff Patton. Previous Agile India conferences have been extremely successful, having held thousands of attendees from dozens of countries all over the world, such as India, Sri Lanka, Singapore, Malaysia, Australia, the United States, the United Kingdom, China, and many more. This year, there is expected to be over 1300 participants in attendance. Previous conference sponsors have included companies such as Hewlett Packard, Siemens, GitHub and General Electric. This year’s sponsors include J.P. Morgan, Innovation Roots, and Scrum Alliance.
ZoomCharts For Agile India 2015 March 23-30, 2015
Check out ZoomCharts products: Network Chart Big network exploration Explore linked data sets. Highlight relevant data with dynamic filters and visual styles. Incremental data loading. Exploration with focus nodes. Time Chart Time navigation and exploration tool Browse activity logs, select time ranges. Multiple data series and value axes. Switch between time units. Pie Chart Amazingly intuitive hierarchical data exploration Get quick overview of your data and drill down when necessary. All in a single easy to use chart. Facet Chart Scrollable bar chart with drill-down Compare values side by side and provide easy access to the long tail. ZoomCharts http://www.zoomcharts.com/ The world’s most interactive data visualization software