Download
1 / 4
40 likes | 184 Views
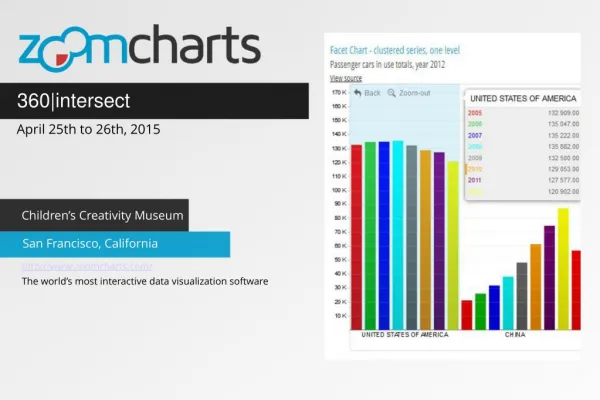
ZoomCharts is offering data visualization tools to support speakers at the Big Data Developer Conference, taking place from April 25th to 26th, 2015 at the Children’s Creativity Museum in San Francisco, California. Check out what you can do with ZoomCharts charts and graphs at http://zoomcharts.com ZoomCharts’ line of advanced data visualization software is fully interactive, supports big data, works on all modern devices including touch screens, and does it all at incredibly fast speeds. These tools are being discovered by a growing number of clients in a variety of fields as the best way to analyze and present data. Don’t be among the last to discover the exciting potential that ZoomCharts tools can open up for your data. 360|intersect is an innovative alternative to the regular tech gathering. It is a one of a kind event aimed to connect speakers and attendees in technology and design to share stories and to inspire other members of the community. Now in its third year, and featuring two days of inspirational talks, presenters include designers, developers, coders, writers, researchers, artists, and supporters of open source. Check out ZoomCharts products: Network Chart Big network exploration Explore linked data sets. Highlight relevant data with dynamic filters and visual styles. Incremental data loading. Exploration with focus nodes. Time Chart Time navigation and exploration tool Browse activity logs, select time ranges. Multiple data series and value axes. Switch between time units. Pie Chart Amazingly intuitive hierarchical data exploration Get quick overview of your data and drill down when necessary. All in a single easy to use chart. Facet Chart Scrollable bar chart with drill-down Compare values side by side and provide easy access to the long tail. ZoomCharts http://www.zoomcharts.com The world’s most interactive data visualization software

E N D
360|intersect April 25th to 26th, 2015 Children’s Creativity Museum San Francisco, California http://www.zoomcharts.com/ The world’s most interactive data visualization software
ZoomCharts for 360|intersect April 25-26, 2015 ZoomCharts is offering data visualization tools to support speakers at the Big Data Developer Conference, taking place from April 25th to 26th, 2015 at the Children’s Creativity Museum in San Francisco, California. Check out what you can do with ZoomCharts charts and graphs at http://zoomcharts.com ZoomCharts’ line of advanced data visualization software is fully interactive, supports big data, works on all modern devices including touch screens, and does it all at incredibly fast speeds. These tools are being discovered by a growing number of clients in a variety of fields as the best way to analyze and present data. Don’t be among the last to discover the exciting potential that ZoomCharts tools can open up for your data. 360|intersect is an innovative alternative to the regular tech gathering. It is a one of a kind event aimed to connect speakers and attendees in technology and design to share stories and to inspire other members of the community. Now in its third year, and featuring two days of inspirational talks, presenters include designers, developers, coders, writers, researchers, artists, and supporters of open source. https://zoomcharts.com/en/blog/zoomcharts-for-360-intersect-april-25-26-2015
ZoomCharts For 360|intersect April 25-26, 2015
Check out ZoomCharts products: Network Chart Big network exploration Explore linked data sets. Highlight relevant data with dynamic filters and visual styles. Incremental data loading. Exploration with focus nodes. Time Chart Time navigation and exploration tool Browse activity logs, select time ranges. Multiple data series and value axes. Switch between time units. Pie Chart Amazingly intuitive hierarchical data exploration Get quick overview of your data and drill down when necessary. All in a single easy to use chart. Facet Chart Scrollable bar chart with drill-down Compare values side by side and provide easy access to the long tail. ZoomCharts http://www.zoomcharts.com/ The world’s most interactive data visualization software