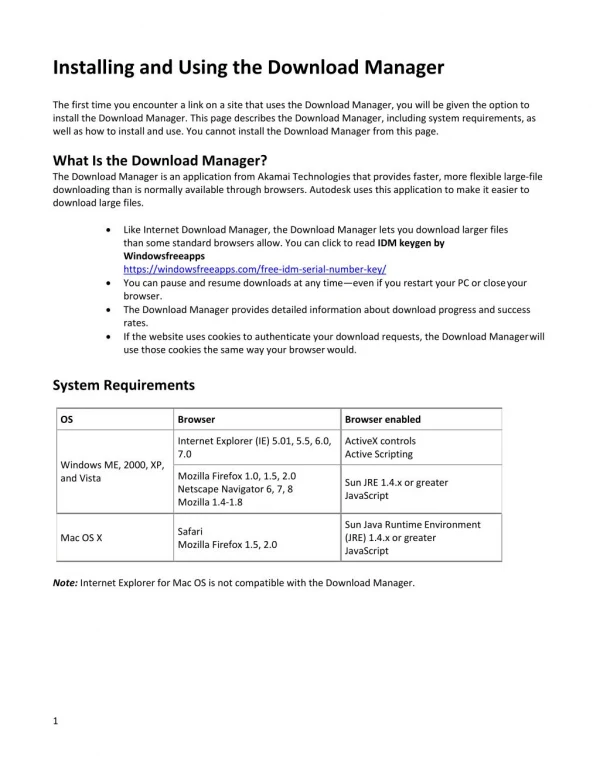
Download
1 / 8
80 likes | 253 Views
ZoomCharts Net Chart - Interactive Highlight https://zoomcharts.com/en/gallery/all:highlight-path Keeping your connections, talking points, or production path and processes in order is easy with our Interactive Highlight feature. You can zoom in, zoom out, focus, move, expand, focus or hide each data cell to reflect the changes in your business cycle as soon as they happen. This feature is great for creating and managing professional social “circles” or supply chain and distribution channels with a single touch. Zoomcharts Interactive Highlight is the latest go-to data tool leveraged by engineers, educators, consultants, marketers, manufacturers, project management professionals and upper management in order to maximize efficiency and close the communication gap. - Visual mapping enables you to see the “bigger picture” - Quick and easy to manipulate fluid data points - Keep information current and correct - Helps everyone stay in the “loop” Quick User Tips: Step 1. Hover or tap one of the nodes to highlight the path to it Step 2. Clicking on the nodes will expand their neighbors Step 3. Drag and drop to rearrange Step 4. Pinch out/in to zoom-in/out Step 5. Right click on the node opens an info window Check out ZoomCharts products: Network Chart Big network exploration Explore linked data sets. Highlight relevant data with dynamic filters and visual styles. Incremental data loading. Exploration with focus nodes. Time Chart Time navigation and exploration tool Browse activity logs, select time ranges. Multiple data series and value axes. Switch between time units. Pie Chart Amazingly intuitive hierarchical data exploration Get quick overview of your data and drill down when necessary. All in a single easy to use chart. Facet Chart Scrollable bar chart with drill-down Compare values side by side and provide easy access to the long tail. ZoomCharts http://www.zoomcharts.com The world’s most interactive data visualization software

E N D
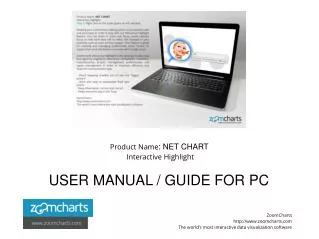
Product Name: NET CHART Interactive Highlight USER MANUAL / GUIDE FOR PC ZoomCharts http://www.zoomcharts.com The world’s most interactive data visualization software
Product Name: NET CHART Interactive Highlight Keeping your connections, talking points, or production path and processes in order is easy with our Interactive Highlight feature. You can zoom in, zoom out, focus, move, expand, focus or hide each data cell to reflect the changes in your business cycle as soon as they happen. This feature is great for creating and managing professional social “circles” or supply chain and distribution channels with a single touch. Zoomcharts Interactive Highlight is the latest go-to data tool leveraged by engineers, educators, consultants, marketers, manufacturers, project management professionals and upper management in order to maximize efficiency and close the communication gap. - Visual mapping enables you to see the “bigger picture” - Quick and easy to manipulate fluid data points - Keep information current and correct - Helps everyone stay in the “loop ZoomCharts http://www.zoomcharts.com The world’s most interactive data visualization software
https://zoomcharts.com/en/gallery/net-chart:highlight-path ZoomCharts http://www.zoomcharts.com The world’s most interactive data visualization software
https://zoomcharts.com/en/gallery/net-chart:highlight-path ZoomCharts http://www.zoomcharts.com The world’s most interactive data visualization software
https://zoomcharts.com/en/gallery/net-chart:highlight-path ZoomCharts http://www.zoomcharts.com The world’s most interactive data visualization software
https://zoomcharts.com/en/gallery/net-chart:highlight-path ZoomCharts http://www.zoomcharts.com The world’s most interactive data visualization software
https://zoomcharts.com/en/gallery/net-chart:highlight-path ZoomCharts http://www.zoomcharts.com The world’s most interactive data visualization software
ZoomCharts http://www.zoomcharts.com The world’s most interactive data visualization software