POVERTY MAPS
250 likes | 566 Views
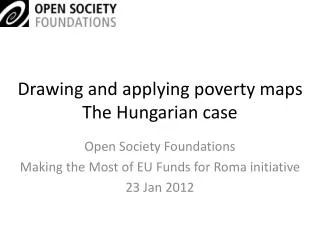
POVERTY MAPS. Needs Assessment Conference on Census Analysis - NACCA III Bali, Indonesia 23 – 25 November 2011. Alejandra Silva CELADE, Population Division UN ECLAC. Poverty. Poverty is a complex and multidimensional phenomenon and that is why

POVERTY MAPS
E N D
Presentation Transcript
POVERTY MAPS Needs Assessment Conference on Census Analysis - NACCA III Bali, Indonesia 23 – 25 November 2011 Alejandra Silva CELADE, Population Division UN ECLAC
Poverty • Poverty is a complex and multidimensional phenomenon and that is why • there isn‘t only one point of view when measuring, defining and quantifying poverty. • The measurement and quantification of poverty is going to depend on the approach adopted.
Poverty There are four common and widely used approaches that are based in the needs and deprivations, life standards, human rights, gender disparity and lack of resources: • The income approach • The unsatisfied basic needs approach • The human rights approach • The gender approach
Poverty Maps • Aggregate, national level indicators of poverty and deprivation often hide important differences between regions or areas. The analysis of poverty, its determinants and poverty-reducing interventions therefore, requires a focus on poverty and vulnerability information that is further geographically disaggregated. • The plotting of poverty and deprivation indicators on maps – poverty mapping – is useful to display information on the spatial distribution of welfare and its determinants. • It is also useful to display simultaneouslydifferent dimensions of poverty and/or its determinants. • It is a geographical targeting instrument of social programs. • Results of poverty maps are used for the allocation of funds and various social benefits programs resources.
1. Highlighting geographic variations • Aggregate, national level indicators often hide important differences between different regions or areas. In almost all countries, these differences exist and can often be substantial. • The next map provides an example of how disaggregated poverty indicators can reveal additional information national level indicators. It shows where are the municipalities in Latin America with higher percentages of children living under poverty conditions, even crossing national boundaries.
2. Simultaneously displaying different dimensions of poverty and/or its determinants • Maps are powerful tools for presenting complex information in a visual format that is easy to understand. They can summarize multiple dimensions in a simple display, something difficult to do otherwise. • The disaggregation by geographic area may be used to simultaneously display two or more indicators – for instance by presenting poverty headcounts and location of schools or medical centers. • Maps encourage visual comparison and make it easy to look for spatial trends, clusters, or other patterns
3 .Understanding poverty determinants • A poverty map can be used to display simultaneously the outcome of interest (children living under deprivation, income poverty, incidence of disease, school enrolment, etc.) and its determinants (school location, infrastructure, health center location, natural resources endowment, access to input and output markets, etc.). • This allows deepening our understanding of the determinants of poverty. • The spatial representation can therefore complement regression analysis to help us understand the influence of these determinants and their interaction.
4. Selecting and designing interventions • Poverty maps can be used to inform policy makers on what intervention to select (when choosing from a number of policy options) and on the details of its possible design. • Selecting interventions – Poverty maps can be used to identify areas in which development has been lagging behind, and which may therefore benefit most from additional resources. • Poverty mapping is also used for emergency response and food aid programs. • Designing interventions – Once an intervention has been decided, poverty mapping can further be useful for its actual design.
5. Informing decentralization • Poverty maps can also help inform decentralization. • For instance, they can help inform the level at which a certain type of intervention or service is best managed and controlled by showing the area which benefits from them.
6. Fostering participation at the local level • At the local level, poverty maps can also play an important role in communicating information. • Because all stakeholders, including non-specialists, can easily understand them, poverty maps are an important tool for the participatory definition of priorities and interventions.
How are poverty maps built? • Information sources: Poverty maps can be built using censuses, surveys, administrative data and other sources of information. • Geographic Information Systems (GISs): GISs are software programs which allow displaying information on the basis of their geographic coordinates. They allow combining information from heterogeneous sources. • Spatial Statistics and the use of Local Indicators for Spatial Autocorrelation –LISA. These statistics allow to identify spatial relationships between areas according to their location.
Information Sources: Surveys and Censuses • Surveys provide very comprehensive information on a broad range of dimensions of living standards and their determinants. On the down side, they only cover a relatively small subset of households or individuals and aren’t representative for small areas. Surveys are only representative at relatively aggregated levels – such as regions. • Censuses provide information on all individuals and households in a country, thereby allowing for the finest geographic disaggregation. Census data can be compiled for small administrative areas, for communities, villages, and towns. On the downside, censuses are typically not carried out very frequently (usually once a decade) and they only collect information on a limited set of variables.
Example of spatial autocorrelation for measuring children poverty (UBN approach) • Statistical methods specifically developed for georeferenced data such as Spatial Autocorrelation and LISA (local indicators for spatial autocorrelation) were used to identify if there existed spatial grouping or clusters in relation to child poverty. • Poverty measured according to Unmet Basic Needs approach.
Variables and thresholds used for the indicators The estimation for every indicator of the deprivations thresholds were defined following the UBN methodology (using census data) as follows: • Shelter. % of children (0-17) that live in houses built with low quality roofs and exterior walls materials or under overcrowding conditions or with any bedrooms in the house. • Water: % of children (0-17) that live in houses that are not supplied by public or private pipe system. • Sewerage: % of children (0-17) that live in houses that don’t have toilet connected to a public or private sewerage system. • Education: % of children (0-17) that are not currently attending school.
Some findings • Shelter deprivation : In Central America there are more than 6 million of children and adolescents who are distributed in 837 municipalities and live in homes with deprivation of shelter. • Deprivation of drinking water: Also, we found more than 6 million children and adolescents distributed in the 575 municipalities who live in homes with no access to drinking water.
Spatial correlation computed for the % children (0 – 17) living with shelter deprivation
Spatial correlation computed for the % children (0– 17) living with drinking water deprivation
We can see the existence of hot spots of municipalities with high percentage of children living with no access to drinking water in the central zone of Mexico In the north bordering zone between Nicaragua and Honduras occupied by ethnic communities Moskitia A small part of Panama corresponding to the native region NgöbeBuglé Hot spots relationship with the location of indigenous communities
Final Comments • The findings suggests that the behavior/ performance of the deprivation components used in the analysis of the spatial autocorrelation allow us to localize groups of municipalities spatially related (sometimes even crossing boundaries) with the same conditions of poverty affecting a high percentage of children. • Poverty maps are a valuable tool that meet the ever growing demand for reliable statistical information disaggregated geographically and articulate the needs of the countries to prioritize the country’s poorest areas.