Download
1 / 1
10 likes | 133 Views
Global Multiscale Model ing on NASA Supercomputers: Extended-Range Simulations of MJOs and AEWs. Bo-Wen Shen 1,2 , Wei-Kuo Tao 2 , William K. Lau 2 ; Robert Atlas 3 1 UMCP/ESSIC; 2 NASA/GSFC; 3 NOAA/AOML bo-wen.shen-1@nasa.gov. 疾風知馬力. I. INTRODUCTION :

E N D
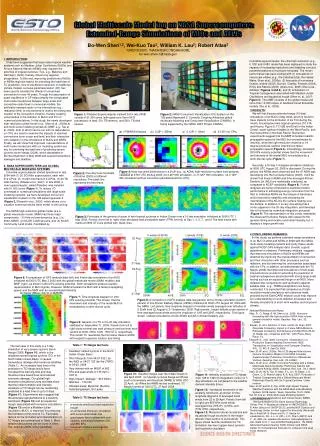
Global Multiscale Model ing on NASA Supercomputers: Extended-Range Simulations of MJOs and AEWs Bo-Wen Shen1,2, Wei-Kuo Tao2, William K. Lau2; Robert Atlas3 1UMCP/ESSIC; 2NASA/GSFC;3NOAA/AOML bo-wen.shen-1@nasa.gov 疾風知馬力 I. INTRODUCTION: It has been suggested that large-scale tropical weather systems such as Madden-Julian Oscillations (MJOs) and African Easterly Waves (AEWs) may regulate the activities of tropical cyclones (TCs, e.g., Maloney and Hartmann, 2000), thereby influencing regional precipitation. To this end, improving predictions of MJOs or AEWs might be helpful for extending the lead-time of TC prediction. Due to insufficient resolution in traditional climate models, cumulus parameterization (CP) has been used to emulate the effects of unresolved convection for over 40 years. Though the assumption of quasi-equilibrium in CP helps simplify the complicated multi-scale interactions between large-scale and convective-scale flows in numerical models, the artificially imposed scale for the interactions (e.g., relaxation time) is now believed to restrict the timing and location of the convection initiation, thereby creating uncertainties in the initiation of MJOs and TCs in numerical simulations. In this study, the newly developed high-resolution global model (e.g., Shen et al., 2006a,b) and multi-scale modeling framework (MMF, e.g., Tao et al. 2009), both of which can be run with no dependence on CPs, are used to examine the impacts of resolved convections (over ocean and land) and their interaction with radiation on the simulations of MJOs and AEWs. Finally, we will show that improved representations of multi-scale interactions with our modeling system are key for extending the lead time of predicting severe cyclonic storm Nargis (2008), which devastated in Burma (Myanmar) in May 2008 and caused tremendous damages and fatalities. Columbia supercomputer, the ultra-high resolution (e.g., 0.125o and 0.08o) model has been deployed to study the impacts of increasing resolutions and disabling cumulus parameterizations on hurricane forecasts. The model performance has been verified with (1) simulations of mesoscale eddies (e.g., the Catalina Eddy, the Hawaii Wake, Shen et al., 2006a); (2) forecasts of hurricanes Gustav, Isidore (2002), Bonnie, Charley, Frances (2004), Emily and Katrina (2005) (Atlas et al., 2005; Shen et al., 2006a,b; Figures 3 and 4); and (3) simulations of Tropical Cyclogenesis associated with Madden-Julian Oscillations and equatorial trough (Shen et. al., 2007; Figure 5). The MMF consists of the global model and more than 10,000 copies of Goddard Cloud Ensemble models (Tao et al., 2009). 3 RESULTS: We will first discuss extended-range (15-day) simulations of an MJO in May 2002, which is found to have impacts on the formation of six TCs during the month, including two twin tropical cyclones (TC 01A and Kesiny, Figure 5; TC 02B and Errol) in the Indian Ocean, super-typhoon Hagibis in the West Pacific, and Hurricane Alma in the East Pacific. Numerical experiments suggest that the MMF simulates realistic propagation speed of the MJO but overestimates its intensity, while the high-resolution model at a 1/4 degree produces realistic intensity but faster propagation speed (Figure 6). Interestingly, simulated 200-hPa velocity potential shows that the movement and intensity of the model MJO is modulated by a semi-diurnal cycle (Figure 7). Secondly, a 30-day 1/4 degree simulation initialized at 0000 UTC August 22, 2006 is discussed. During this period, five AEWs were observed and the 4th AEW was developing into the hurricane Helene (2006). It will be shown that these 5 AEWs and time-averaged African Easterly Jet (AEJ) are realistically simulated, as compared to NCEP reanalysis (Figure 8). Further analyses are being conducted to examine model’s performance in simulating energy conversion from the AEJ to individual AEWs via the release of barotropic and/or baroclinic instability and simulating the maintenance of the AEJ by the surface heating over the Sahara. In addition, it is very interesting that a vortex appears in the 20-day integration, and develops into a hurricane as numerical integration proceeds (Figure 9). The representation of this vortex resembles the observed Hurricane Helene with respect to the genesis timing and location and initial intensity, but it displays a larger growth rate. Figure 1:Pleiades Supercomputer (ranked 3rd in late 2008) consist of 51,200 cores (with quad-core Xeon 5472 processors) in total, 50+ TB memory, and 500+ TB disk spaces. Figure 2: NASA Concurrent Visualization (CV) System on the 128-panel Hyperwall-2. Currently, Coupling Advanced global multiscale Modeling and Concurrent Visualization (CAMVis) is being supported by the NASA AIST Project CAMVis. (d) 0.125o (no CPs) (a) H*WINDS Analysis (b) 0.25o (~25km) (c) 0.125o (~12km) 2. NASA SUPERCOMPUTERS and GLOBAL MULTISCALE MODELING SYSTEMS Columbia supercomputer started operations in late 2004 with (1) 20 SGI Altix superclusters, each with 512 CPUs; (2) 10,240 Intel Itanium II CPUs; (3) 20 TB total memory (Biswas et al., 2007). In late 2008, a new supercomputer, called Pleiades, was installed with 51,000 cores (Figure 1). To reduce I/O overheads in numerical simulations with large-scale modeling systems, we have developed concurrent visualization system on the 128-panel hyperwall-2 (Figure 2, Ellsworth et al., 2006), which allows us to visualize numerical results while model is still running. The NASA high-resolution global model (a.k.a. global mesoscale model, GMM) has three major components: (1) finite-volume dynamics (e.g., Lin, 2004, MWR), (2) NCAR CCM3 physics, and (3) NCAR Community Land model. Facilitated by Figure 4: Near-eye wind distributions in a 2ox2o box. (a) AOML high-resolution surface wind analysis validated at 0730 UTC 29 Aug 2005, (b) 0.25o 99h simulation, (c) 0.125o 99h simulation, (d) 0.125o 96h simulation without convection parameterizations (CPs). Figure 3: Five-day track forecasts of Katrina (2005) at different resolutions. The black line represents the best track. Figure 5: Forecasts of the genesis of a pair of twin tropical cyclones in Indian Ocean from a 10-day simulation initialized at 0000 UTC 1 May 2002. Panels ((from left to right) show simulated total predictable water (TPW, km/m2) at Day 1, 3, 5, 7, and 9.The best tracks with marks at 0600 UTC are plotted with black lines. 4 CONCLUNDING REMARKS: In this study, we perform extended-range simulations of an MJO in 2002 and AEWs in 2006 with the NASA multi-scale modeling systems and verify these results against NCEP GFS analysis data. Overall, a good agreement is obtained. Preliminary analysis suggests that improved simulations of MJOs and AEWs are obtained by improving the representation of convection and their interaction with other processes such as radiation, and by removing the uncertainties associated with the CPs. In addition, we demonstrate with the TC Nargis (2008) that improved simulations of multi-scale interactions are crucial for extending the prediction of tropical cyclogenesis associated with strong large-scale forcing such as an equatorial trough or an MJO. More detailed inter-comparisons and verification against satellite data (e.g., TRMM precipitation) are being conducted. It is expected that comparisons of high-resolution model simulations with observed fields provided by the EarthCARE mission could help improve our understanding of could-radiation processes and thereby simulations of short-term weather and long-term climate. V winds (5-20oN) U winds (10oE) U winds (20oE) 22 Aug pressure pressure TEJ AEJ AEJ 21 Sep 22 Aug pressure pressure TEJ Figure 6: A comparison of GFS analysis data (left) and fifteen-day simulations of an MJO initialized at 0000 UTC May 2 2002 with the global mesoscale model (GMM, middle)) and MMF (right), as shown in 200-hPa velocity potential. Both simulations produce realistic representation of MJO signals. However, GMM simulates the MJO with a faster propagating speed, and the MMF with an overestimated intensity. AEJ AEJ 21 Sep 30oN 50oW 40oE 30oN EQ EQ Figure 7: Time-longitude diagram of 200-hPa velocity potential. This shows that the movement and intensity of the model MJO is modulated by a semi-diurnal cycle. Figure 8: A comparison of GFS analysis data (top panels) and a 30-day simulation (bottom panels) of five African Easterly Waves (AEWs) initialized at 0000 UTC August 22, 2006 with the GMM. Left panels: time-longitude diagram of meridian winds averaged over latitudes of 5-20oN from 22 August to 21 September, 2006. Right panels : height-latitude cross section of time-averaged zonal winds along the longitude of 10oE and 20oE, respectively. This figure shown realistic simulations of both AEWs and AEJ (African Easterly Jet). Selected References and Notes: Atlas, R., O. Reale, B.-W. Shen et al., 2005: Hurricane forecasting with the high-resolution NASA finite volume general circulation model. Geophys. Res. Lett., 32, L03801. Biswas, R., M.J. Aftosmis, C. Kiris, and B.-W. Shen, 2007: Petascale Computing: Impact on Future NASA Missions. Petascale Computing: Architectures and Algorithms 29-46 (D. Bader, ed.), Chapman and Hall / CRC Press, Boca Raton, FL. Ellsworth D., et al. 2006: Concurrent Visualization in a Production Supercomputing Environment. IEEE Transactions on Visualization and Computer Graphics, VOL. 12, NO. 5, Sep/Oct 2006. Shen, B.-W. et al., 2006a: The 0.125 degree finite-volume General Circulation Model on the NASA Columbia Supercomputer: Preliminary Simulations of Mesoscale Vortices. Geophys. Res. Lett., 33, L05801. Shen, B.-W. et al., 2006b: Hurricane Forecasts with a Global Mesoscale-Resolving Model: Preliminary Results with Hurricane Katrina (2005). Geophys. Res. Lett., 33, L13813. Shen, B.-W., W.-K. Tao, R. Atlas, Y.-L. Lin, R. Reale, J.-D. Chern, C.-D. Peters-Lidard, K.-S. Kuo, 2007: Forecasts of Tropical Cyclogenesis with a Global Mesoscale Model: Preliminary Results with Six Tropical Cyclones. Under revision. Shen, B.-W. and W.-K. Tao, 2008: High-impact Tropical Weather Prediction with the NASA Multi-scale Modeling System. SC08. Austin, Texas, November 15-21, 2008. Tao, W.-K et al., 2009: Multi-scale Modeling System: Development, Applications and Critical Issues. BAMS. Figure 9: Genesis of a TC in the 20-day simulation validated on September 11, 2006. Panels from left to right show minimal sea level pressure and low-level wind vectors at 0000, 0600, 1200, 1800 UTC, respectively. This model TC resembles the Hurricane Helene (2006) with respect to genesis location and timing. Concluding Remarks Table 1: TC Nargis fast facts The last case in this study is a 7-day simulation of very severe cyclonic storm Nargis (2008, Figure 10), which is the deadliest named tropical cyclone (TC) in the North Indian Ocean Basin. It caused tremendous damage and numerous fatalities (Table 1). An increased lead time in the prediction of TC Nargis would have increased the warning time and may therefore have saved lives and reduced economic damage. Our global high-resolution simulations using real data show that the initial formation and intensity variations of TC Nargis can be realistically predicted at a lead time of up to 5 days (Figure 11). Experiments also suggest that the accurate representations of a westerly wind burst (Figure 12) and an equatorial trough, associated with monsoon circulations (Figure 13) and/or a Madden-Julian Oscillation (MJO), is important for predicting the formation of this kind of TC. Favorable factors for the formation and intensification of TC Nargis are summarized in Table 2. More detailed discussions can be found in Shen, Tao, and Lau (2009, to be submitted). • Deadliest named cyclone in the North Indian Ocean Basin • Short lifecycle: from 04/27 03Z ( by the IMD) or 04/27 12Z (by the JTWC) to 05/03, 2008 • Very intense with an MSLP of 962 hPa and peak winds of 135 mph (~ CAT 4) • High-Impact: damage ~ $10 billion; fatalities ~ 134,000 • Affected areas: Myanmar (Burma), India Bangladesh, Sri Lanka Figure 10: Satellite images over the Indian Ocean in late April 2008. (a) tropical cyclones Durga and Rosie south of a westerly wind burst/jet (WWB) at 0000 UTC, 22 April; (b) When the WWB moved northward, TC Nargis formed at 1200 UTC, 27 April 2008. Figure 11: Intensity evolution of TC Nargis from 108 to 144h of integrations (red) in a 7-day simulation, as compared to the satellite derived intensity (blue). Figure 12: Northward movement of the westerly wind burst, as shown in time-longitude diagrams of averaged zonal winds from 22 to 29 April. Panels (from left to right) are 850-hPa zonal winds averaged over (5oS,0o), (0,5oN), and (5oN,10oN), respectively. Table 2: TC Nargis fast facts Acknowledgments: We thank NASA ESTO (Earth Science Technology Office), Prof. A Busalacchi (director of UMCP/ESSIC), Dr. P. Arkin (director of UMCP/CICS), and the NSF Science and Technology Center for their support for this study. We would like to thank Mr. B. Bryan and Dr. C. Henze for visualizations, Drs. J.-L. Li (JPL), J.-D. Chern (GSFC) and Y. Jin (NRL) for valuable discussions. Acknowledgment is also made to Dr. T. Lee at NASA Headquarters, the NASA Advanced Supercomputing (NAS) Division and NASA Center for Computational Sciences for computer time used in this research. • a westerly wind burst and equatorial trough • an enhanced monsoon circulation with a zero wind shear line • good upper-level outflow with anti-cyclonic wind shear between 200 and 850 hPa • low-level moisture convergence Figure 13: Monsoon lateral circulations and equatorial trough as shown in the height-latitude cross section of zonal winds. This figure shows favorite conditions for TC formation: low-level (upper-level) cyclonic (anti-cyclonic) circulation.