Download
1 / 15
150 likes | 295 Views
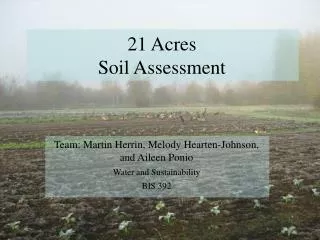
Assessment of the Nutrient Water Quality in the Ditch System of 21 Acres . For BCSUSP 119 By Jan Wnek, Kelly McNemee , Winnie Kwan, Victor La and Davis Sellers- Halgren June 2008. Results. Nitrate concentrations are high in the ditch water.

E N D
Assessment of the Nutrient Water Quality in the Ditch System of 21 Acres For BCSUSP 119 By Jan Wnek, Kelly McNemee, Winnie Kwan, Victor La and Davis Sellers-Halgren June 2008
Results • Nitrate concentrations are high in the ditch water. • Standard deviations around the mean NO3- values were atypically high for Site D (+/- 0.91 on 5/12/08 and +/- 0. 58 on 5/19/08) and Site A (+/- 0.48 on 5/12/08) reducing our confidence in the accuracy of the mean values on those dates. • Ammonia and phosphate levels were quite low.
M on 5/12/08 NO3 – 0.68 mg/l NH3 – 0.08 mg/l PO4 – 0.02 mg/l D on 5/5/08 NO3 – 1.01 mg/l NH3 – 0.07 mg/l PO4 – 0.02 mg/l D on 5/12/08 NO3 – 1.31 mg/l NH3 – 0.03 mg/l PO4 – 0.02 mg/l D on 5/19/08 NO3 – 1.59 mg/l NH3 – 0.05 mg/l PO4 – 0.07 mg/l A on 5/12/08 NO3 – 0.7 mg/l NH3 – 0.007 mg/l PO4 – 0.02 mg/l A on 5/19/08 NH3 – 0.004 mg/l PO4 – 0.02 mg/l B on 5/12/08 NO3 – 0.58 mg/l NH3 – 0.02 mg/l PO4 – 0.08 mg/l B on 5/19/08 NO3 – 0.30 mg/l NH3 – 0.006 mg/l PO4 – 0.07 mg/l
Conclusions • More sampling is needed to determine how representative these results are. Seasonal variations are likely to be high. • It would be interesting to see if nutrient concentrations and speciation changes along the ditch system due to phytoremediation.
Site M Church retention pond All photos by Winnie Kwan
Site D Drainage ditch. Note the algal growth.
Site B Drainage ditch with stagnant water and algae bloom.
Site A Flowing drainage ditch. Note lack of algae bloom.