Download
1 / 38
390 likes | 602 Views
Chapter 14 Cost of Capital. 14.2 Estimating the Weights. 14.3 Estimating the Costs of Capital. 14.4 Assembling the Pieces. 14.1 The Marginal Cost of Capital Schedule. Chapter 14 Outline. Step 1: Calculate the proportions of capital Step 2: Estimate the costs of capital

E N D
14.2 Estimating the Weights 14.3 Estimating the Costs of Capital 14.4 Assembling the Pieces 14.1 The Marginal Cost of Capital Schedule Chapter 14 Outline • Step 1: Calculate the proportions of capital • Step 2: Estimate the costs of capital • Step 3: Assemble the pieces • Chapter Summary • The Cost of Capital • The WACC: The Basics • Steps in Calculating the Weighted Average Cost of Capital • What is Capital? • Financial Structure vs. Capital Structure • Which Weights should be Used? • Estimating Market Values of Common Shares • Estimating Market Values of Preferred Shares • The Cost of Debt • The Cost of Preferred Equity • The Cost of Common Equity • The Gordon Model • Sustainable Growth, Retention, and the Return on Equity
14.1 The Marginal Cost of Capital Schedule • The cost of capitalis the return the investor requires; hence, we refer to the cost of capital as the required rate of return from the perspective of the suppliers of funds (that is, the creditor or owner). • The cost of capital is often used in valuing a company, a subsidiary, or any asset, whereby future cash flows are discounted at the cost of capital to estimate a value.
The Cost of Capital The cost of capital is a marginal cost, the cost of raising an additional dollar of financing. We calculate this marginal cost of capital as the weighted average cost of capital, or WACC, where: • the weights are the proportions of capital the company uses when it raises new capital • the costs are the marginal cost for each source of capital
The WACC: The Basics We can represent this in notation form as:
The WACC: The Basics (continued) • V represents the total value of the company’s capital, • Drepresents the value of debt, • Prepresents the value of preferred stock, • Erepresents the value of common equity, and • r*d, rp, and rerepresent the marginal costs of capital for debt, preferred equity, and common equity, respectively.
The WACC: The Basics (continued) We can simplify this using the notation for the weights of the different sources of capital, the wt, as:
The WACC: The Basics (continued) • The reason we designate the cost of debt differently than the costs of preferred and common equity (that is, with an “*”) is that the relevant cost of debt is the after-tax cost because of the tax deductibility of interest. • Therefore, for every dollar of interest paid, the company only bears a portion of that dollar
14.2 Estimating the Weights • When calculating the cost of capital, we weight the component costs of capital by the proportion of capital that each source of capital represents when the company raises additional capital. • We must first determine what is “capital”, and then we will deal with the appropriate proportions.
What is Capital? • Capitalis that it is the sum of the interest-bearing debt and the equity of a company. • Debt capital consists of the interest-bearing obligations of the company, whereas equity capital is the sum of the capital of preferred and common shareholders.
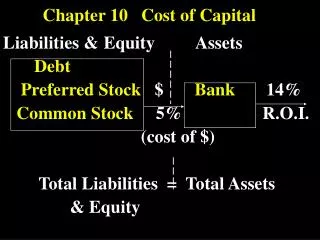
Financial Structure vs. Capital Structure • A company’s financial structure is the entire set of liabilities and equity accounts, whereas the capital structureof the company is how this invested capital is financed by debt and equity capital. • The distinction between a company’s financial and capital structure is that the financial structure includes all liability and equity, whereas the capital structure includes only invested capital. • Invested capitalis the sum of the debt capital and equity capital.
Example of Financial Structure vs. Capital Structure The financial structure is $2,000, consisting of $1,000 of liabilities and $1,000 of equity. The capital structure consists of invested capital and is $1,700: $1,000 in shareholders’ equity, and $700 of interest-bearing debt (i.e., $50 1 $650). This capital structure results in a debt-to-equity ratio of $700 4 $1,000 5 0.70 and a debt-to-invested-capital ratio of $700 4 $1,700 5 0.41.
Which Weights Should Be Used? • Theoretically, we would like to use the proportions that represent the company’s target capital structure, that is, the capital structure that the company aims for over time. • However, we cannot observe this target capital structure. • As a next-best alternative to the target capital structure, absent other information that may indicate otherwise, we use a company’s present capital structure as the best estimate of the target capital structure. • We generally use the market values of the capital that the company uses because we assume that the financial decision making of a company is based on market values of capital, rather than on the book values.
Estimating Market Values of Common Shares • This is straightforward whenever a company has shares that are traded publicly. • We simply use the market capitalization, which is the product of the company’s market price per common share and the number of shares outstanding. • If the equity is not publicly traded, we need to use an approach such as the method of multiples to estimate the value based on market multiples of comparable, but publicly traded companies.
Estimating Market Values of Preferred Shares Estimating the market value of a company’s preferred sharesis also quite straightforward if they are publicly traded. In the event that the company’s preferred shares are not actively traded, we can estimate the market value of the preferred shares by using the present value of a perpetuity equation, where Pp is the price per share, Dp is the dividend per share, and rp is the required rate of return on preferred shares:
14.3 Estimating the Costs of Capital Our objective is to estimate what it would cost the company to raise additional capital—specifically one more dollar of capital. This is the marginal cost of capital. The marginal cost of capitalis the cost of raising one more dollar of capital. To this end, we need to estimate the marginal costs of each of the sources of capital the company uses.
First: The Cost of Debt • The cost of debt is the yield or interest on debt if the company borrows one more dollar. • If the company has publicly traded debt, you can look at sources such as FINRA for yields: www.FINRA.org • Although that may seem simple, it is more complicated than that because most large companies have many issues of debt outstanding.
Example: Apple Computer Source: www.FINRA.org
Example: Apple Computer Source: FINRA.org
Cost of debt after taxes The cost of debt is adjusted for the tax benefit of interest deductibility: where t is the marginal tax rate.
Example$2,000 debt @ 8%, t=40% Without interest deductibility With interest deductibility 64 less in taxes 0.048 or 4.8% Or,
Second: The Cost of Preferred Equity We estimate the cost of preferred shares, rp, at the ratio of the dividend to the current value of a share.
Third: The Cost of Common Equity • The value of a common share is the present value of its future dividends. • The dividend discount model (DDM)represents the value of a share of stock today as the present value of all future dividends, discounted at the stock’s required rate of return. • A special case of the DDM is the constant growth version of the dividend discount model (DDM), which represents the value of a share of stock as the present value of a growingperpetuity.
The Gordon Model The dividend discount model with constant growth is commonly referred to as the Gordon model. The basic valuation equation with constant growth is: The price of a share, P0, equals the expected next period’s dividend, D1, divided by the return required by common share investors, re, minus the forecast long-run growth rate, g, in dividends and earnings.
The Gordon Model (continued) • We can rearrange this equation to estimate the common equity investors’ discount rate or required rate of return. This process is the discounted cash flow method for estimating the investors’ required rate of return: • In this equation, the required rate of return is composed of the expected dividend yield, D1÷ P0, plus the expected long-run growth rate, g. • The long-run growth rate is then the estimate of the increase in the share price and the investors’ capital gain.
Example: Cost of equity Consider a company that has a current dividend of $1 per share and a current share price of $20. If the dividends are expected to grow at a rate of 5 percent per year, what is the required rate of return for this stock? We are given: D0= $1 P0= $20 g= 5%
Solution • The current dividend is $1, so next period’s dividend, D1, is $1 x (1 + 0.05) = $1.05. • Calculate D1: D1 = D0 (1 + g) = $1.00(1.05) = $1.05 • Calculate the dividend yield = $1.05 $20 = 4.2% • Calculate the cost of equity: re = 4.2% + 5% = 9.2%
Sustainable Growth, Retention, and the Return on Equity • One of the issues we face in estimating the value of a share of stock is how to estimate the growth rate. • Although the actual growth rate of the value of a share of stock may change from year to year, what we are most concerned with in valuing a stock today is the long-term growth of the stock’s value. • We can estimate this long-term growth using the sustainable growth rate. Sustainable growth rateis the growth we expect a company to be able to sustain in the future. We estimate sustainable growth as the product of the company’s retention rate, b, multiplied by forecasted return on equity (ROE):
Risk-based Models and the Cost of Common Equity • The most important risk-based model is the capital asset pricing model (CAPM), which states that the expected return on a stock is the sum of the expected risk-free rate of interest and a premium for bearing market risk, • Specifically the stock’s beta multiplied by the difference between the expected return on the market and the risk-free rate of interest. • We can represent the central equation of the CAPM :
The expected risk-free rate of return, rf, which represents compensation for the time value of money. • The expected market risk premium [rM- rf], which is compensation for assuming the risk of the market portfolio; rM is the expected return on the market. • The beta coefficient (or simply beta), bi, for the company’s common shares, which measures the company’s systematic or market risk. Capital Asset Pricing Model (CAPM) Formula
Flotation Costs and the Marginal Cost of Capital • One complication that arises with respect to all sources of capital, except for internally generated funds, is that the company incurs issuing costsor flotation costswhen new securities are issued. • These include any fees paid to the investment dealer and/or any discounts provided to investors to entice them to purchase the securities. • As a result, the cost of issuing new securities will be higher than the return required by investors because the net proceeds to the company from any security issue will be lower than that security’s market price.
Approaches to adjust for flotation costs • Adjust individual cost for the cost of flotation • Problem: timing (flotation costs are up-front, costs of capital affect all flows of a project) • Subtract flotation costs from the projects(s) net present value. • Issue: not always possible to associate financing with a particular investment project
14.4 Assembling the Pieces Once we have the weights and the costs of the different sources of capital, we calculate the weighted average cost of capital:
Chapter Summary • The WACC is a market value weighted average of the marginal costs of the different sources of capital. • If the company earns its WACC, then its present market values are supported; if it is expected to earn less than its WACC, then its market value will fall, and if it is expected to earn more than its WACC, then its market value will increase. • The weights in the WACC are the proportions that each source of capital represents when the company raises new capital. • If we assume that the company is at its target capital structure, then we use the current capital structure as the target capital structure. When calculating the proportions, it is important to use the market value of the different sources of capital, not the book or carrying values.
Chapter Summary (continued) A proxy for the before-tax cost of debt is the yield on the company’s current debt. We can proxy the cost of preferred equity in a similar manner, looking at how the market currently prices the company’s preferred stock. The most challenging estimate in the WACC is that for the cost of common equity capital. In estimating this, the financial decision maker can use the dividend discount model (or variants) of this model, or the capital asset pricing model. We use the proportions and the costs of each source of capital to estimate the weighted cost of capital. This weighted cost of capital is a marginal cost because each of the component costs is a marginal cost.