Download
1 / 22
220 likes | 362 Views
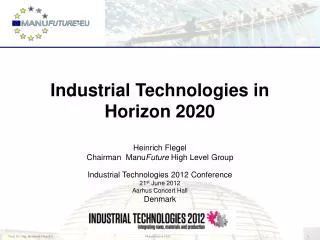
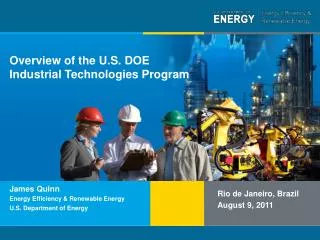
Presentation to States Energy Advisory Board U.S. Department of Energy July 26 2006. Industrial Technologies Program. Overview. Industrial Energy Context The Industrial Technologies Program’s (ITP’s) Focus Results & Highlights Save Energy Now Initiative State Outreach & Resources.

E N D
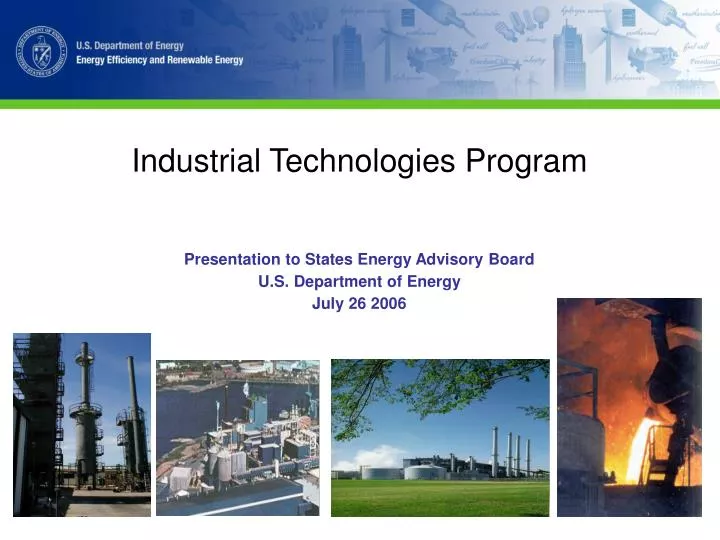
Presentation to States Energy Advisory Board U.S. Department of Energy July 26 2006 Industrial Technologies Program
Overview • Industrial Energy Context • The Industrial Technologies Program’s (ITP’s) Focus • Results & Highlights • Save Energy Now Initiative • State Outreach & Resources
Growth in demand for limited resources have increased prices and market volatility, impacting national energy security, economic security, and environmental quality National energy security: Global oil andgas reserves are in unstable areas andflexible alternatives are not readily available. Economic security: Rising prices hurtAmerica’s ability to remain competitive inthe global market place. Global Warming: Global concernsregarding carbon emissions and climatechange are forcing industries and governmentsto rethink their strategies on energy fuels. Global Energy Challenges Require Innovative Solutions Natural Gas Prices, Henry Hub 1994-2007 $ per Million Btu Oil Prices, West TX Intermediate 1948-2007 $ per Barrel Consideration of these challenges hasled the US government to reevaluate how it can most effectively respond.
Chemicals 7.8 0.9 Aluminum 7.3 Petroleum Refining Fabricated Metals 0.7 Forest Products 3.3 Plastic & Rubber 0.7 1.9 Iron & Steel Food Processing 1.6 Non-Metallic Minerals 1.4 4.1 Non-Mfg Other Mfg. 3.8 Industry: Critical to National Energy Picture (Quadrillion Btu) 2004 Energy Use* 100.3 Quads Industry is the largest energy using sector • 37% of U.S. naturalgas demand • 29% of U.S. electricity demand • 30% of U.S. greenhouse gas emissions • Uses more energy than any one of the other G8 nations Industry 33% Transportation 28% Japan Total Energy Consumption - 22.4 Quads Commercial 18% Residential 21% *Includes electricity losses Source: DOE/EIA Monthly Energy Review 2004 (preliminary) and estimates extrapolated from MECS
Volatile energy prices Industry concern about naturalgas costs and supply Influence of the emergingeconomies on competitive landscape and energy and raw materials prices Difficulty for process industries to make needed investments in R&D and commercialization Potential for “game-changing” scientific advances to transform industries Challenge for Energy-Intensive Industries Natural Gas Prices, Henry Hub, LA Dollars per Million Btu
The Industrial Technologies Program (ITP) Delivering Technology Solutions Collaborative R&D • Energy-intensiveProcess Technologies • Crosscutting Technologies Technology Delivery Partnerships • Assessments • Training & Tools
ITP R&D Areas: Focus on Energy Efficiency High Temperature Processes Industrial Reaction and Separation Develop energy efficient high-temperature process technologies for producing metals and non-metallic minerals Develop technologies for efficient reaction and separation processes • Advanced Metal Heating and Reheating • Advanced Melting • Efficient Heat Treating • High Efficiency Calcining • Next-Generation Steelmaking • Oxidation Processes • Microchannel Reactors • Hybrid Distillation • Alternative Processes • Advanced Water Removal 335 Trillion Btu/yr in 2020 470 Trillion Btu/yr in 2020 Fabrication and Infrastructure Energy Conversion Systems Develop high efficiency steam generation and combustion technologies and improved energy recovery technologies Develop energy efficient technologies for making near net-shape finished products from basic materials • Near Net Shape Casting and Forming • Energy Efficient and Safe Extraction Operations • Inferential Process Control for Product Quality • Ultra-hard Materials • Joining and Assembly • Thermal Transport Systems • Super Boiler • Ultra-High Efficiency Furnace • Waste Heat Recovery 570 Trillion Btu/yr in 2020 250 Trillion Btu/yr in 2020
Emerging Technologies: Super (Industrial) Boiler • U.S. Industrial Boilers: • Largest industrial energy application;6 quadrillion Btu (quads)/year • Over 30,000 large boilers (75% over 30 years old) • All manufacturing sectors • U.S. Opportunity: • Accelerate replacement of aging boilers with • 94% efficiency/7 ppm Units • Save 500 trillion Btu/year • Reduce carbon emissions by 27 Tg(0.4% of U.S. total emissions) Built and installed pilot-scale boilers at GTI
Technology Delivery: Annual Energy Savings 2012 Energy Savings By YearFY 2000-2012 Tools & Training By Activity Type IACs Qualified Specialists ESAs EPAct Voluntary Program Trillion Btu By Fuel Type Coal Natural Gas Fuel Oil • By 2012: • Save 2% of US total natural gas • Meet 67% of President’s Carbon Reduction goal • Save $12.5 billion of energy costs from today Diesel LPG Electricity Other
ITP Technology Delivery Strategy Small 5% Manufacturing EnergyUse • Goals: • By 2012, help 50,000 plants assess their energy savings opportunities and implement strategies to achieve 2.5% energy savings. • By 2012, get 50 of our participating companies that own some of the largest energy-consuming plants to commit to at least a 2.5% annual reduction in energy intensity (per EPAct 106). • By 2015, the majority of U.S. industrial companies have embraced best energy management practices (measured through MECS). Mid-Size 37% Large 58% 10-30% savings potential 5-15% savings potential 2002 EIA MECS Strategies • Deliver energy management tools and resources (technology and best operating practices) to manufacturing plants. • Leverage public/private sector to deliver resources. • Establish DOE-company agreements with appropriate recognition (EPAct 106). • Accelerate private investment in energy efficiency and energy-efficient technologies.
DOE Experts • Information Center • Website ITP Technology Delivery Channels EPAct industry commitments & recognition Products&Services All Plants States, Partners and Qualified Specialists Large Plants Corporations Energy Service Companies Medium and Small Plants Medium Plant Outreach: IACs and MEPs Increase results and accelerate implementation
More than 170commercializedtechnologies to date Nearly 5 quads of energy saved since program inception; 366 trillion Btu in 2004 alone* 17 R&D 100 awards since2000; 39 awards since 1991 Over 13,000 U.S. manufacturing plants impacted through Technology Delivery efforts** More than 150 patents issued under ITP-sponsored R&D 1994–2005. Accomplishments Benefit Assessment Process • ITP is the only EERE Program that has voluntarily elected to evaluate R&D results through retrospective study. • Despite inherent challenges in tracking, ITP has assessed impacts for >20 years. Though imperfect, improvements are ongoing. • A 2001 review by the National Research Council, NAS, determined that the “industrial programs are cost-effective and have produced significant energy, environmental, and productivity benefits…” and “the non-energy economic benefits—such as improved productivity—that are achieved by some of these technologies often far exceed the energy savings…” *Source: 2006 IMPACTS Report **ITP has provided assistance, in the form of tools, training, assessments or consultations to these plants.
Energy Savings Assessment Status (7/20/06) • 130 Energy Savings Assessments completed (out of 200 planned this year) • Results of 86 assessments have identified a total potential natural gas savings of 25 trillion Btu per year – equal to 350,000 US homes • 6 month follow-up to estimate implementation in progress Secretary Bodman (right) at the Caterpillar Tractor Energy Savings Assessment “While [Dow] has been a leader in energy efficiency, with DOE’s help, we found yet more cost-effective opportunities to save precious energy.” Completed Assessments Scheduled AssessmentsAs of July 24, 2006 John Dearborn,Global Business VP, Energy, Dow
Target 260 ESAs in Calendar Year 2007 Compare to 200 in Calendar Year 2006 Expanded outreach Communications to 3,500 large energy using plants Trade associations Greater cost share 3rd parties able to cost share up to 10 ESAs Additional cost shared ESAs available to applicants More energy system types Compressed air, pump and fan systems Increase implementation and replication Continual follow-up by ITP field team Publicity and case studies for companies replicating Recognition program for high implementers 2007 Energy Savings Assessments
Selected State and ITP Accomplishments • Joint Save Energy Now outreach • Texas Technology Showcase • Ohio Technology Showcase • California Energy Fairs • Saving Water; Saving Energy in Colorado • Nevada Mining Energy Solutions Event • Western US Food Processing Efficiency Initiative
Recent state industrial solicitation focused on encouraging proposals to: leverage and accelerate Save Energy Now results through cost-shared Energy Savings Assessments and follow-up implementation with plants which have received an ESA. form multi-state collaborations to build on varying strengths of state industrial partnerships bring forth ideas for accelerating fuel flexibility technology commercialization bring forth innovative ideas to accelerate industrial energy efficiency technologies (e.g., financing, loans, etc.) Update on current partnership efforts
Accelerating State and ITP Results • Cooperate to drive strategic initiatives such as Save Energy Now and Energy Flexibility/Gasification • Leverage market players (e.g., utilities, ITP Allied Partners, Qualified Specialists, and regional groups such as the Northwest Energy Efficiency Alliance) • Focus efforts toward largest energy consuming facilities (2%/60% rule) • Increase awareness of ITP emerging technologies and commercialization opportunities • Strategically communicate to state level policy-makers • Develop and agree on standard impact tracking systems and metrics Are we jointly having as much impact as we can?