Download
1 / 17
190 likes | 401 Views
September 14, 2006. Heat Storm: Update on CPUC Follow-up Actions. Steve Larson Executive Director California Public Utilities Commission. The Heat Storm Was an Extraordinary Event Throughout the State (1). PG&E highest temperatures in 34 years Peak load 13% higher than last year

E N D
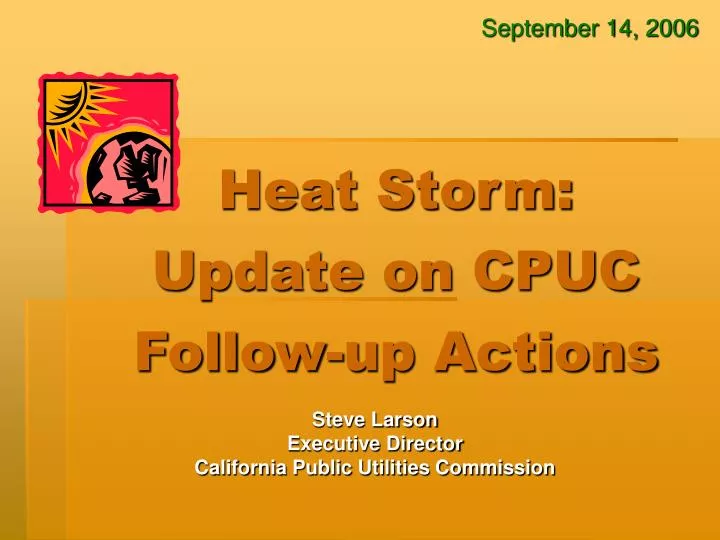
September 14, 2006 Heat Storm: Update on CPUC Follow-up Actions Steve Larson Executive Director California Public Utilities Commission
The Heat Storm Was an Extraordinary Event Throughout the State (1) • PG&E highest temperatures in 34 years • Peak load 13% higher than last year • SCE one in ten year event • Peak load 3.6% higher than last year • SDG&E one in 25 year event • Peak load 11% higher than last year • ISO Peak: 50,270 MW – 11% higher than 2005. Reserves were at 5%.
The Heat Storm Was an Extraordinary Event Throughout the State (2) • Storm affected electricity grid during weeks of July 17 and July 24 • 138 deaths attributed to the heat storm • The electric distribution infrastructure took a beating • Transformers failed • PG&E 1200 • SCE 1375 • SDG&E 170 • Customers lost distribution service, most for short times • PG&E 1.3 million • SCE 1.1 million • SDG&E 45,000
ISO, Generators, Utilities, Firefighters, and Customers Rose to the Occasion • ISO operated the grid efficiently and flexibly • Generators kept the power plants operating • Utility crews replaced blown transformers • Firefighters protected the grid • Customers responded to Flex Your Power calls
PUC Action Plan Underway Now • Increase Targeted Energy Efficiency • Increase Demand Response • New Local Generation
Increase Targeted Energy Efficiency • PG&E and SCE now soliciting additional third party programs using 2006-2008 program budgets. • Looking for innovative, targeted energy efficiency programs focusing on high-demand areas.
Increase Demand Response • Increased Air Conditioner Cycling • Demand Response Programs For This Summer • Demand Response Programs For 2007 and Beyond
Increase Air Conditioner Cycling • Peevey Assigned Commissioner Ruling August 15 • Directs Edison to bring 300 MW more online by Summer 2007 • Directs PG&E, SDG&E to report on opportunities
Increased Demand Response Programs for this Summer • E-4009: No advice letter. Initiated by Energy Division. Adopts a new triggering mechanism for the Demand Reserves Partnership program for the purpose of increasing demand response for the remainder of this summer. • E-4011: SDG&E AL 1811-E. Approves modifications to SDG&E’s C&I 20/20 Program for the purpose of increasing more demand response for the remainder of this summer. • E-4012: PG&E AL 2870-E. Approves a modification to the Demand Bidding Program (PG&E/SCE/SDG&E) for the purpose of increasing demand response for the remainder of this summer. • E-4018: PG&E AL 2880-E. Approves re-opening PG&E’s Interruptible tariff for remainder of 2006 but not 2007.
Demand Response Programs for Next Summer and Beyond • Peevey Assigned Commissioner Ruling August 9 • Directed new demand response proposals August 30th. • Received proposals for new and expanded existing programs. • Commission decision in November.
New Local Generation • Five New Generators for Edison, and Requests by PG&E and SDG&E • Peakers • Dispatchable • Supports local distribution system
Increased Use of Cooling Centers (1) • PG&E • 31 Cooling Centers PG&E separately refers approximately 300 customers who self-identify as “heat sensitive” to Rotating Outages Cooling Stations. PG&E is also expanding its efforts to inform its customers about how to take care of themselves in the event of extreme heat.
Increased Use of Cooling Centers (2) • SCE • 38 Cooling Centers • SCE has outreach program for targeted populations through informational fliers, public service announcements, targeted mailings, targeted events, local newspapers, and through established partnerships with businesses and other community-based organizations. • In response to lessons learned during the last heat wave, SCE contractors have implemented grass roots door-to-door outreach within farm-worker communities, senior housing, and low-income housing developments to inform vulnerable populations of the availability of Cool Center sites.
Increased Use of Cooling Centers (3) • SDG&E • San Diego County has 150 Cooling Centers • SDG&E provides partial support to San Diego County’s Cool Zones Program through its CARE program. • Outreach for the Cool Zones program is a collaboration between SDG&E and the County of San Diego. A kick-off event was held which received local media attention, and the County also promotes Cool Zones through its own methods.
Taking Stock and Planning for the Future • Is our forecasting good enough? • Are we out of the woods for this summer? • What does next summer look like? • What about the future?
Maximum Temperature 250 200 150 Number of Days 100 50 0 58 61 64 67 70 73 76 79 82 85 88 91 94 97 100 103 106 109 Temperature (F) 1950-1974 1975-2000 Maximum Temperature 300 250 200 150 Number of Days 100 50 0 53 56 59 62 65 68 71 74 77 80 83 86 89 92 95 98 102 Temperature (F) 1925-1949 1950-1974 1975-2000 Maximum Temperature 200 180 160 140 120 Number of Days 100 80 60 40 20 0 60 67 70 73 76 79 82 85 88 91 94 97 100 103 106 109 112 Temperature (F) 1950 - 1974 1975 - 2000 Distribution of Maximum Temperatures: June - September Pasadena Berkeley Fresno