Download
1 / 28
280 likes | 404 Views
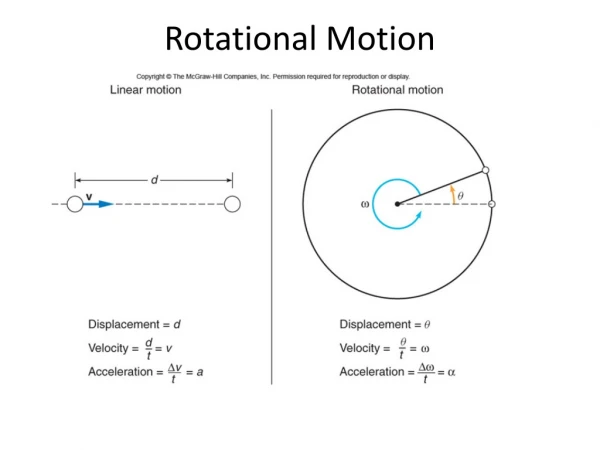
Jet Phenomena in the Solar Atmosphere with Rotational Eruption or Spinning Motion; Observation associated with Our MHD numerical Simulations. 2004 年 4 月 12 日. 宮腰 剛広. Jets associated with Rotating Eruption or Spinning Motion. Observations. Kurokawa et al. 1987, Solar Phys., 108, 251

E N D
Jet Phenomena in the Solar Atmosphere with Rotational Eruption or Spinning Motion; Observation associated with Our MHD numerical Simulations 2004年4月12日 宮腰 剛広
Jets associated with Rotating Eruption or Spinning Motion Observations • Kurokawa et al. 1987, Solar Phys., 108, 251 • Canfield et al. 1996, Apj, 464, 1016 • Pike and MASON, 1998, Solar Phys., 182, 333 • Alexander and Fletcher, 1999, Solar Phys., 190, 167 Theory • Shibata and Uchida, 1986, Solar Phys. magnetic twist packet propagates open coronal fields The mass in the high density twisted loop is driven put into the open flux tube due to both pinch effect and JXB force at the front of the packet. Hot core (by pinch effect) and Cool sheath (unwinding front of the magnetic twist) is formed.
Ha -5.0A NOAA 4474, 23 April 1984 A, B: delta type sunspots p: preceding f: following activity: A>>B Ha +-0A
22:35 / 23, Apr Ap: westward motion Bf : eastward motion (motion with emergence) C, Af: not clear motion 22:05 / 24, Apr AFS : Ap and Bf (opposite polarities) neutral line filament (fig2,a) B: filament normal to neutral line weak shear A: filament parallel to neutral line strong shear Two X class flares on A: 04 UT on 24 Apr 00 UT on 25 Apr B: no strong flare
Ha center X13: 00 UT on 25 Apr • pre flare • great two ribbon flare • occurred • (b)(c) helically twisted • structure • (c)(d) helical twists are • gradually untwisted • (e) started to spout up of • untwisting rotation • (f) filament is hardly visible • in Ha line center
... but erupting process is clearly seen in Ha wing The curling fine structures of the filament indicate unwinding rotational motion of the spouting material along the axis of the filament.
velocitygrams Ha +-1.0 or +- 0.8 with the photographic subtraction method (Leighton et al. 1962) white: the velocity toward the observer black: the velocity away from us EF : erupting filament PFL : downward motions in the post-flare loops EF: left part, black right part, white clear separation indicates the rotating motion around the spouting axis of the filament The direction of the rotation coincides with that of the detwisting of the helical twist found in Figure 4.
EF SE : secondary eruption my left the chromosphere around 00:43 UT microwave absorption was observed 00:50 – 00:58 at TRO (Enome 1985); good temporal coincidence the second ejection extended along the line S in Figure 7 and absorbed the microwave radiation emitted by the sunspots and post-flare loops
the velocity of the erupting filament projected to the sky plane: 120 km/s rotational : 50km/s (Figure 6) 50 km/s (rotation) must be larger than the line-of-sight component of the ascending velocity. Otherwise, the clear separation of black and white along the filament axis cannot be seen so clearly in the velocitygrams 120: projection to the sky rising 120/tan(shita)<50, shita>68 120 shita line of sight rising filament almost normal to the line-of-sight shita 50 from side 50
R : NRO (Figure 7) moving type IV bursts, 200-830 km/s (Figure 8) angle between R and P is small (<15 deg), so directly compared in Figure 8 It is obvious that the moving type IV burst is closely connected to the erupting filament cloud.
22:07, 24/Apr two hours before the flare 21:38, 25/Apr neutral line filament normal neutral weak shear filament // neutral strong shear Observed characteristics agree well with those derived from the simulation of Shibata and Uchida (1986) twisted F: nearly parallel T: large angle
NOAA 7260, 1992 Aug 19-20 The 23:11 UT Event Yohkoh and Mees footpoint: saturated P0a Contour: SXT, image: Mees, Ha Yohkoh SXT
Expanded image of the footpoint it consists of two loops upper and lower parts often have different brightness only this time is saturated
F: footpoints L: interfootpoint regions The light curves of these regions are significantly different. These images and light curves show that the flaring X-ray structure consists of two loops that are contiguous, end to end.
surge SXT loop bright point (Ha)
SXT contour grayscale: IVM magnetogram -, weaker field no spot +, near satellite -, near the moving satellite spots polarity inversion line
Ha red Ha blue 23:11:30 Ha center Ha velocity contours reveal the location of the 23:11 surge due to its rotational motion angular rate: 10^-3 rad/s, lasting 1000 s SXT the spin is right handed (all the surges in table 1)
six of nine surge/jet events show highly localized Ha downflow at a bright point at the base of the surge, and eight of nine events show that the surge is located over the outer loop downflow region is located at the base of the surge It is at the north footpoint of the north loop, i.e., the footpoint farthest from p0a
fig6 area stage 1: blueshifts gradually develop. Ha gradually brightens although no-Xray brightening supports that this is Doppler brightening. Ha center SXT stage 2: Ha brightens dramatically and X-ray emission begins to increase. (maximum value) stage 3: X-rays peak and a strong redshift appears and peaks with a delay of about 1 minute with respect to the time of peak blueshift. (surge base downflow motion)
The 18:34 UT event in contrast to the previous event, it appears to occur in a plane that is considerably inclined to the line of sight. figure 9 area Ha surge X-ray not cospatial X-ray Jet Ha
(fig8 box) period A: two small penumbral filaments one is more curved than the other The end of the one rears up in a whiplike manner, while the other remains in place. Period B: two brightenings approach one another (20 km/s) This converging footpoints phenomenon has not reported before. • period C: A blueshifted (dark) linear structure • appears in all images, moving from right to • left along a path parallel to the penumbral • filament that showed whiplike motion in strip • The measured transverse speed of • propagation of the blueshift region averages • 25 km/s, peaks 120 km/s black: blue shift white: red shift Ha line center
cool plasma moves, caused Doppler beightenings in Ha weak reconnection, (bit strongly heated) The bipole associated with the moving satellite spots and Ha penubbral filaments reconnection between open fields and strongly twisted bipole loops (Shibata & Uchida 1986) strong heating begins Ha surges above X-ray jet downward
The observed a: 0.4/Mm (Leka et al. 1994) length of filaments: l~20Mm, stored twist is several radians. strong of twist is enough 10^-3 radian times 10^3 s equal 1 radian. moving blueshift with whiplike motions conversing footpoints
Alexander and Fletcher, 1999, Solar Phys., 190, 167 TRACE observation
Vy component z y z x x Vy (紙面垂直速度成分) 赤:+ 青:- Vy + - (コロナアルフベン速度の 約10%ぐらい) emerging flux region