Download
1 / 14
150 likes | 319 Views
Dendroclimatology March 28, 2013. Tree-ring data are just one of type of many proxies of past climate. Dendroclimatology. Dendroclimatologists are interested in past climate….why? Synoptic climatology –. Climate conditions can be estimated from a variety of natural

E N D
Dendroclimatology March 28, 2013
Tree-ring data are just one of type of many proxies of past climate.
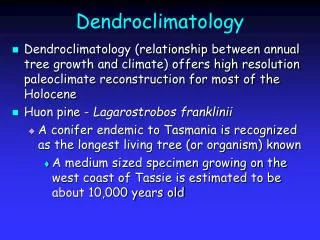
Dendroclimatology Dendroclimatologists are interested in past climate….why? Synoptic climatology – Climate conditions can be estimated from a variety of natural environmental records going back to well before humans existed.
Dendroclimatology • Site selection • Tree age • Tree shape • Injured trees or those in the understory are avoided • Sample depth • Standardization removes non-climatic trends • Climate data
Correlation analysis and Response Function Analysis • Correlation analysis complements results from response function analysis. • RFA primarily concerned with temp and precip. Correlation analysis can be done on ALL climate variables • Range of values = -1.0 < r < +1.0 • Associated with each r-value is its p-value which tests for statistical significance. • In general, we want p-values less than 0.05, or p < 0.05. • As in response function analysis, we also analyze months from the previous growing season (why?). • As in response function analysis, we look for groupings of monthly variables to indicate seasonal response by trees.
Correlation analysis • R-values also known as Pearson correlation coefficients • SAS output below: r-value (top), p-value (middle), n size (bottom) • How do you interpret negative correlations? Pearson Correlation Coefficients Prob > |r| under H0: Rho=0 Number of Observations lmayt ljunt ljult laugt lsept loctt lnovt -0.08019 -0.03131 -0.34233 -0.16914 -0.29516 -0.09849 -0.02712 0.4941 0.7897 0.0023 0.1414 0.0096 0.4071 0.8173 75 75 77 77 76 73 75
Dendroclimatology Teleconnection – the interconnection of physical parameters over long distances Primary Variables: - Temperature (ave, min, max) - Precipitation (total) - Palmer Drought Severity Index (PDSI) - Palmer Hydrologic Drought Index (PHDI) Derived Variables: - El Nino Southern Oscillation (ENSO) - North Atlantic Oscillation (NAO) - Atlantic Multidecadal Oscillation (AMO) - Pacific Decadal Oscillation (PDO)