yed
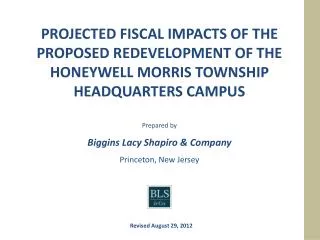
yed. PROJECTED FISCAL IMPACTS OF THE PROPOSED REDEVELOPMENT OF THE HONEYWELL MORRIS TOWNSHIP HEADQUARTERS CAMPUS Prepared by Biggins Lacy Shapiro & Company Princeton, New Jersey. Revised August 29, 2012. Projected Revenues & Costs. Projections are rounded. 1.

yed
E N D
Presentation Transcript
yed PROJECTED FISCAL IMPACTS OF THE PROPOSED REDEVELOPMENT OF THE HONEYWELL MORRIS TOWNSHIP HEADQUARTERS CAMPUS Prepared by Biggins Lacy Shapiro & Company Princeton, New Jersey Revised August 29, 2012
Projected Revenues & Costs Projections are rounded 1
Derivation of School Revenues and Costs Taxpayer Perspective Board of Ed Perspective * Per Rutgers University Center for Urban Policy Research Study. Listokin, D. (2006). “Who Lives in New Jersey Housing? A Quick Guide to New Jersey Residential Demographic Multipliers.” ** Per pupil expenditure estimate based on NJ Department of Education report: Comparative Pupil Expenditures 2011. *** Rounded per Rutgers multipliers . 4
Other Revenue and Cost Key Assumptions (1) Estimated capital investment of $99.6 million to complete demolition, abatement and site work, renovate building and furnish space, etc. (2) Based on Rutgers University Center for Urban Policy Research Study. Listokin, D. (2006). “Who Lives in New Jersey Housing? A Quick Guide t o New Jersey Residential Demographic Multipliers. “ Multipliers are as follows: 1.914 for 2BR units and 2.444 for 3BR units. (3) The number of jobs is based on the proposed square footage as compiled by the NJ Department of Community Affairs Standards - Exhibit B, as follows: a 2.8 ratio for Class A Office and 1.7 ratio for other categories including Retail establishments. (4) See next page. Per Rutgers University Center for Urban Policy Research Study. Listokin, D. (2006). “Who Lives in New Jersey Housing? A Quick Guide t o New Jersey Residential Demographic Multipliers. “ Projections are rounded. (5) Per pupil expenditure estimate based on NJ Department of Education report: Comparative Pupil Expenditures 2011Report. 5
Public School Children Generation (From Rutgers CUPR study) * Based on 2006 Rutgers CUPR Study 6