Download
1 / 12
120 likes | 318 Views
Traffic modeling and system capacity performance measure. Authors:. Date: 2014-07-14. Abstract. In this presentation we present a simple traffic modelling method as well as system capacity evaluation methodology. Traffic model: File transfer & Web browsing.

E N D
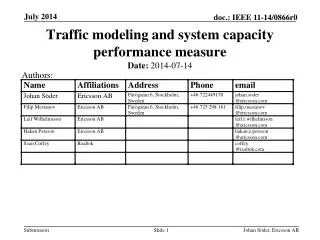
Johan Söder, Ericsson AB Traffic modeling and system capacity performance measure Authors: • Date: 2014-07-14
Johan Söder, Ericsson AB Abstract In this presentation we present a simple traffic modelling method as well as system capacity evaluation methodology
Johan Söder, Ericsson AB Traffic model: File transfer & Web browsing • STA positions from the simulation scenario document [1] are considered as tentative STA locations, i.e., STAs are not connected/active all the time, just when they have data in the buffer • Files arrive independently in the buffers of the STAs(UL) and the APs (DL, files labelled with a receiver STA) • Arrival process is a Poisson process • Arrival intensity of DL and UL files has ratio, e.g, 80/20 (parameter to be agreed on) • Different system loads are modelled by varying arrival intensity, the file size is kept constant • Sample file size is 1MB
Johan Söder, Ericsson AB Traffic model: Video streaming • Similar approach may be applied for video streaming traffic • Randomly select which users are streaming the video • Introduce the packets in the buffer regularly instead of randomly (i.e., CBR) • The load will be determined by how many users are doing streaming
Johan Söder, Ericsson AB System capacity evaluation:Definitions • Packet throughput = packet size / packet delay • Packet delay = time from packet arrives in buffer until time the last ACK is received • User throughput = average of packet throughputs for a user • Served traffic = Sum of all successfully received packets / simulation time • Served traffic ~ system arrival intensity * packet size
Johan Söder, Ericsson AB Backoffexpires Backoffexpires Dataarrives Collision Queuingtime Contentiontime Transmissiontime Collisiontime System capacity evaluation:Delay terminology • The packet delay can be further divided into: • Queuing time – waiting while someone else uses the medium • Contention time – backoff and deferrals • Transmission time – transmitting • Collision time – transmission time for failed transmissions
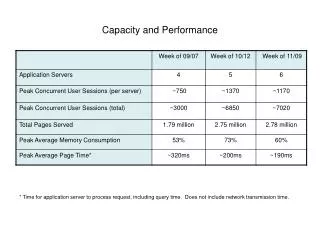
Johan Söder, Ericsson AB System capacity evaluation:Example • Consider 1 AP • Arrival intensity 1 packet / second • Packet size 1MByte = 8Mbit • AP load is 8Mbps • During 100s there will on average be 100 packets • These will all have different packet throughput • Assume the average packet throughput is 40 Mbps • average delay is 0.2s 80s out of 100s there are no ongoing transmissions in the AP Packet tpt Served traffic volume = 100 packets x 8Mbit = 800Mbit Served traffic load = 800Mbit/100s. = 8Mbps P2 P3 64 Mbps P100 P1 32 Mbps 8 Mbit 8 Mbit 8 Mbit 8 Mbit 1/4 s. 3/4 s. 1/8 s. 1 s. 100 s.
Johan Söder, Ericsson AB System capacity evaluation:Example graph Decreased user experience Increased file arrival intensity
Johan Söder, Ericsson AB System capacity evaluation:Performance measurements • As system load (traffic intensity) increases, the delay times in accessing the channel, and the interference probability, will increase lower user throughput • We define the system capacity as the maximum load the system can handle, while still providing sufficient performance • The “sufficient performance” criterion may be defined as “95% of the time, the users should experience throughput above 20 Mbps”, i.e., 5th percentile throughput > 20 Mbps
Johan Söder, Ericsson AB System capacity evaluation:Sample performance Performance requirement (e.g., 20Mbps) System capacity: 13 Mbps/AP
Johan Söder, Ericsson AB Conclusion • Traffic modeling is not related to how many STAs per BSS there are, but rather how much traffic load there is in a certain scenario (i.e., certain area) • System capacity should be measured by the amount of traffic that the system can handle, maintaining a certain level of user experience • Proposals: • Model file transfer, web browsing and video streaming using the proposed method • Evaluate system capacity using the proposed methodology
Johan Söder, Ericsson AB References • [1] 11-14-0621-04-00ax-simulation-scenarios