Download
1 / 25
250 likes | 451 Views
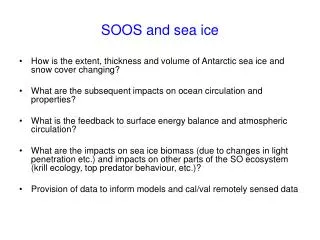
SOOS and sea ice. How is the extent, thickness and volume of Antarctic sea ice and snow cover changing? What are the subsequent impacts on ocean circulation and properties? What is the feedback to surface energy balance and atmospheric circulation?

E N D
SOOS and sea ice • How is the extent, thickness and volume of Antarctic sea ice and snow cover changing? • What are the subsequent impacts on ocean circulation and properties? • What is the feedback to surface energy balance and atmospheric circulation? • What are the impacts on sea ice biomass (due to changes in light penetration etc.) and impacts on other parts of the SO ecosystem (krill ecology, top predator behaviour, etc.)? • Provision of data to inform models and cal/val remotely sensed data
CCSM3 sea ice trends, 1900-2100 • Historical forcing for 20th century • Scenario A1B in 21st century (business as usual) • Downward trend in Antarctic area and volume from ~1960 • Fastest retreat and thinning in Weddell Sea Annual average ice area (km2) Annual average ice volume (m3)
Sea ice parameters for SOOS • Ice extent and concentration • Ice thickness (combined give ice volume) • Snow cover thickness • Ice properties (in situ measurements) • Ice drift (tidal/inertial forcing) • Distribution/abundance of ice algae • Process studies very important (flooding, microstructure, percolation/convection, wave-ice interaction, incorporation of ice algae, Fe, etc.) • Couple with oceanography – moorings/CTDs/ARGO/seal sensors etc.
Ice Extent and Concentration • Daily global coverage from passive microwave • SOOS should strongly articulate the need for continuity of PM sensors • Reanalysis/reprocessing of PM data needs to be done, with rigorous evaluation of available algorithms (IGOS-Cryo report). • Proxies for historical sea ice extent (continential ice cores, whale catch data)….role for SOOS in data recovery?
Ice and snow thickness • Ship observations and ice charts • EM (ship-based and airborne) • Upward-looking sonar (moorings + AUVs) • In situ measurements • Altimetry (satellite and aircraft)
Tracks of 83 ASPeCt voyages: 1980 - 2005 Worby et al. JGR, 2008
US National Ice Centre Ice Charts • Routine weekly ice charts since the 1970’s • Trained ice analysts discern sea ice concentration and during 1995-2000 stage of development using a host of available satellite data • Show average ice conditions integrated over 3-5 day period. Represent the only continental scale estimates of ice type
Ship operates in polar waters Better navigation usingsatellite imagery andarea coverage of Arcticfor climate change Collection of visual images and environmental data using IceCam Data used tointerpret satellite data Improves knowledge ofice-infested waters forshipping and climate change ICECAM - Concept
Sea Ice and Snow Cover Thickness from Remotely Sensed Techniques • EM, radar and laser techniques each have their shortcomings • Knowledge of ice and snow properties is essential
-58 -57 -56 -55 -54 -53 -67 -67 Latitude (°S) -68 -68 -69 -69 -58 -57 -56 -55 -54 -53 Longitude (°W) 250 km Envisat SAR EM data from Weddell Sea. Courtesy C. Haas
ULS measurement sites around Antarctica AWI instruments on top of oceanographic moorings, at depths of 120-180m Along 0deg, data since 1996 Interannual, decadal and climatic variabilility in sea ice thickness
Autonomous Underwater Vehicles • Scientific Payload • Dual conductivity, temperature and depth (SBE-911 CTD) • Dissolved oxygen sensor (SBE-43) • Upward (300kHz) and downward (150 kHz) looking RD Instruments Acoustic Doppler Current Profilers • Simrad EM-2000 swath multibeam bathymetric mapping system was mounted looking upwards Courtesy: Mark Brandon, BAS
Under ice data SEA ICE Krill swarms Brierley,Fernandes, Brandon Science, 2002.
Measurements of under-ice hyperspectral irradiance to estimate ice algal biomass 2 (nm) Correlation coefficient Normalised difference index: NDI=T(1)-T(2)/ T(1)+T(2) (Mundy et al. 2007) 1 (nm)
ICESat sea ice elevations 20 cm ice ridge 0 -- 2 cm noise Ground track Thin-ice covered polynya Land • Illustrates 2 cm range precision of ICESat. • 2 cm precision is important, because mean freeboard is about 30 cm. • Footprint spacing is 170 m. 2 Ron Kwok, JPL
Ice drift • Lagrangian buoys with GPS position • Pressure/temperature sensors • Enhanced network, routine deployments (IPAB) • Fill gaps, particularly in WAP, Ross Sea • Develop an ice buoy that becomes an ARGO float when the ice melts • More sopisticated versions might include: • Thermistor strings through the ice • Mass balance • Radiometer • Wind
Antarctic Fast Ice Network (AFIN) Observed parameters: - Fast-ice thickness - Snow thickness - Freeboard - Dates of ice formation and breakout Observational methods: - In situ weekly observations - Weekly observations using electro-magnetic induction device - Autonomous observatories - Chain of thermistors (high-resolution) - Acoustic pingers: ice-air interface ocean-ice interface - Data logger or remote data uplink to satellite. - PLUS visual observations during transition intervals. • Current participants: • ========================= • - Australia (Petra Heil, Rob Massom) • - France (Catherine Gobin) • - Germany (TBA: after C. Haas' departure) • - Japan (Shuki Ushio) • New Zealand (Tim Haskell, Pat Langhorne, • Joe Troedahl) • - Norway (Sebastian Gerland) • - Russia (Andrey Korotkov)
Ice thickness transects - ice and snow thickness/temperature - ice cores and snow pits - short/longwave radiometer - radar / EM - snow pits - ROV “We need a nice level floe that is representative of the surrounding area” Anon
Changes in sea ice properties AREA AMSR-E snow depth Widespread flooding Snow ice formation Air temp >-4C Wind >50 kts Backscatter Worby et al., 2008b
http://data.aad.gov.au/aadc/seaice Historical data mining and recovery
10-20 year plan • A lot depends on how satellite altimetry develops….. • Repeat transects along lines of longitude at 30-60 degree spacing • AUVs with sub-surface docking stations (less ship time) • Airborne surveys (EM, laser/radar altimetry, UAVs) • Biomass from under-ice irradiance • Identify lead agencies for coordinating data analysis/archival of different data sets (AWI for ULS, AAD for laser altimetry, ?? for AUV etc.) • Process studies • Satellite validation • Small-scale processes (phys/biol/biogeochem) • Development of agreed protocols where they are not already in place (sea ice community lags other disciplines) • Network of integrated fast ice “mass balance” stations • Ice growth/snow accumulation/radiometer for biomass • Development of micro nitrate/fluorometer sensors • Enhanced network of Lagrangian drifters, annual deployments
Current AADC entries Country/ship Ice stations Ice cores Transects Snowpits Australia 1991 Aurora (V1) 11 18 15 1991 Aurora (V2) 3 4 1992 Aurora (V1) 18 29 3 8 1993 Aurora (V9) 23 45 8 17 1994 Aurora (V1) 30 36 5 27 2003 Aurora (ARISE) 12 27 14 48 Germany 1986 P/stern (WWSP 86 – Leg 1) 47 143 1988 P/stern (EPOS) 37 29 18 1989 P/stern (WWGS 89) 31 78 1992 P/stern (WWGS 92) 39 33 24 Japan 1985-88 Syowa station 30 30 1990-92 Syowa station 21 21 2001 Syowa station 8 8 USA 2007 NBP (SIMBA) TOTALS 310 501 77 100