Performance networks
This document provides an overview of the key performance indicators (KPIs) and quality indicators for catering and cleaning services. It includes data on cost per meal and cost per square meter for the top three service providers, along with metrics such as total meals sold, staff food uptake, and satisfaction rates. Additionally, it addresses nutrition standards, sustainability efforts, and user feedback mechanisms. This analysis helps in evaluating operational efficiency and quality trends essential for effective management in schools and other institutions.

Performance networks
E N D
Presentation Transcript
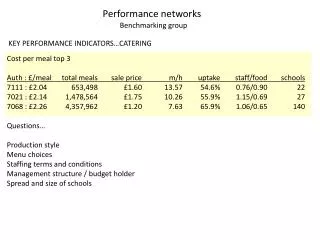
Performance networks Benchmarking group KEY PERFORMANCE INDICATORS…CATERING Cost per meal top 3 Auth : £/meal total meals sale price m/h uptake staff/food schools 7111 : £2.04 653,498 £1.60 13.57 54.6% 0.76/0.90 22 7021 : £2.14 1,478,564 £1.75 10.26 55.9% 1.15/0.69 27 7068 : £2.26 4,357,962 £1.20 7.63 65.9% 1.06/0.65 140 Questions… Production style Menu choices Staffing terms and conditions Management structure / budget holder Spread and size of schools
Performance networks Benchmarking group QUALITY INDICATORS…CATERING Nutrition Nutrient standards? Nutritionist? External funding? Staff training? Breakfast / ASM? Awards? Sustainability Food sourcing? Disposables? Training? Waste policy? Energy reduction? ISO14001 Quality Customer satisfaction? Consultation? Complaints? Staffing Absence? Training? IIP? Job evaluation? Development plans?
Performance networks Benchmarking group KEY PERFORMANCE INDICATORS…CLEANING Cost square metre top 3 Auth : £/m m2 staffratio mat/equi FTE abs m2/h (p) 5138 : £10.01 274,604 92% 3.7% 178 6.24 1.01 5025 : £10.86 562,557 82% 5.9% 362 4.03 0.92 5083 : £11.05 590,104 92% 3.6% 339 4.57 0.98 Questions… Frequency of cleaning Pay rates Input or output spec / cover levels Employment terms and conditions Property types Range of services
Performance networks Benchmarking group QUALITY INDICATORS…CLEANING Quality Customer satisfaction? Consultation? Complaints? Sustainability Environmental policy? Chemical use? Staffing Absence? Turnover? Training?