
Enhanced Filtering Hierarchies for Real-Time Glucose Monitoring
Improve accuracy of continuous glucose sensor data with advanced filtering techniques, reducing errors to less than 5%.

Enhanced Filtering Hierarchies for Real-Time Glucose Monitoring
E N D
Presentation Transcript
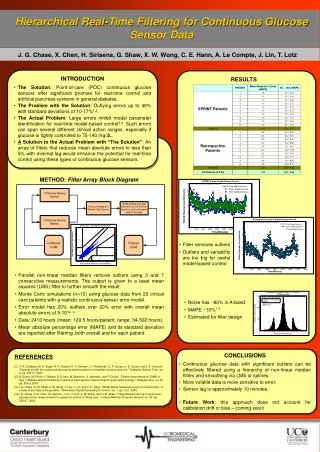
Hierarchical Real-Time Filtering for Continuous Glucose Sensor Data J. G. Chase, X. Chen, H. Sirisena, G. Shaw, X. W. Wong, C. E. Hann, A. Le Compte, J. Lin, T. Lotz • INTRODUCTION • The Solution: Point-of-care (POC) continuous glucose sensors offer significant promise for real-time control and artificial pancreas systems in general diabetes. • The Problem with the Solution: Outlying errors up to 40% with standard deviations of 10-17%1,2. • The Actual Problem: Large errors inhibit model parameter identification for real-time model-based control3,4. Such errors can span several different clinical action ranges, especially if glucose is tightly controlled to 75-140 mg/dL. • A Solution to the Actual Problem with “The Solution”: An array of filters that reduces mean absolute errors to less than 5% with minimal lag would enhance the potential for real-time control using these types of continuous glucose sensors. RESULTS METHOD: Filter Array Block Diagram • Filter removes outliers • Outliers and variability are too big for useful model-based control • Parallel non-linear median filters remove outliers using 3 and 7 consecutive measurements. The output is given to a least mean squares (LMS) filter to further smooth the result. • Monte Carlo simulations (n=10) using glucose data from 20 critical care patients with a realistic continuous sensor error model. • Error model has 20% outliers over 20% error with overall mean absolute errors of 9-10%1-3. • Data: 2410 hours (mean: 120.5 hours/patient, range: 34-502 hours). • Mean absolute percentage error (MAPE) and its standard deviation are reported after filtering, both overall and for each patient. • Noise has ~80% in A-band • MAPE ~10%1-3 • Estimated for filter design • CONCLUSIONS • Continuous glucose data with significant outliers can be effectively filtered using a hierarchy of non-linear median filters and smoothing via LMS or splines. • More volatile data is more sensitive to error. • Sensor lag is approximately 10 minutes. • Future Work: this approach does not account for calibration drift or bias – coming soon! REFERENCES [1] P. A. Goldberg, M. D. Siegel, R. R. Russell, R. S. Sherwin, J. I. Halickman, D. A. Cooper, J. D. Dziura, and S. E. Inzucchi, "Experience with the continuous glucose monitoring system in a medical intensive care unit," /Diabetes Technol Ther/, vol. 6, pp. 339-47, 2004. [2] B. Guerci, M. Floriot, P. Bohme, D. Durain, M. Benichou, S. Jellimann, and P. Drouin, "Clinical performance of CGMS in type 1 diabetic patients treated by continuous subcutaneous insulin infusion using insulin analogs," Diabetes care, vol. 26, pp. 582-9, 2003. [3] J. G. Chase, G. M. Shaw, X. W. Wong, T. Lotz, J. Lin, and C. E. Hann, "Model-based Glycaemic Control in Critical Care - A review of the state of the possible," /Biomedical Signal Processing & Control/, vol. 1, pp. 3-21, 2006. [4] J. G. Chase, C. E. Hann, M. Jackson, J. Lin, T. Lotz, X. W. Wong, and G. M. Shaw, "Integral-based filtering of continuous glucose sensor measurements for glycaemic control in critical care," Comput Methods Programs Biomed, vol. 82, pp. 238-47, 2006


