Download
1 / 30
300 likes | 478 Views
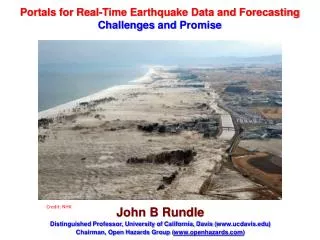
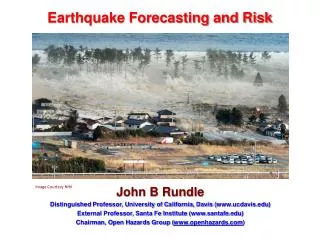
Earthquake Forecasting and Risk. John B Rundle Distinguished Professor, University of California, Davis ( www.ucdavis.edu ) External Professor, Santa Fe Institute ( www.santafe.edu ) Chairman, Open Hazards Group ( www.openhazards.com ) . Image Courtesy NHK. Image Courtesy NHK.

E N D
Earthquake Forecasting and Risk John B Rundle Distinguished Professor, University of California, Davis (www.ucdavis.edu) External Professor, Santa Fe Institute (www.santafe.edu) Chairman, Open Hazards Group (www.openhazards.com) Image Courtesy NHK
Topics • Earthquakes and other Catastrophes • Risk Management as Currently Practiced • Forecasting • Risk Management
Impacts Loss Trends (Munich Re, 2011)
Does not include Hurricane Irene or the M5.8 Virginia earthquake
Does not include Hurricane Irene or the M5.8 Virginia earthquake
Risk Management Currently, risk management is done by big corporations for big corporations Modern social networking technology together with web-based information and tools has enabled a new era of Personal Risk Management
Earthquake Cycle Deficit in fault slip accumulates from large scale plate tectonic motions
The Great 1906 San Francisco Earthquake Extended for ~ 350 km Along the San Andreas Fault in Northern California. Horizontal offsets of as much as 8 meters was observed. Wayne Thatcher, US Geological Survey
The Current Official California Forecast Working Group on California Earthquake Probabilities 2007 Method requires many tens of scientists over ~4 years to produce a single 30 year forecast. Approx. 2000 model parameters whose values are set using “expert opinion”. Method cannot be automated (because it uses expert opinion) so the forecast cannot be backtested.
Financial Strategies for Dealing with Risk: Example Hypothetical $75 Million Single-Peril Earthquake Cat Bond If no earthquake occurs, cat bond returns principal + LIBOR + risk premium after 2 years LEP Curve Calculated by Modeling Company 100% Fraction of Principal Remainng (%) Annual Loss Exceedance Probability $50 Million $75 Million Loss ($) Indemnity Bond London Interbank Offered Rate (LIBOR) ~ 5% / yr Risk Premium ~ 5% / yr Bond Multiple = 5% / 1% = 5 1.0% Fat Tail (Power Law) 0.25% $50 Million Attachment Value $75 Million Exhaustion Value Loss ($)
Advanced Earthquake ForecastOperational Earthquake ForecastingJBR et al., Physical Review E, in press (2012) • Uses ANSS global digital catalog data • Updated in real time • Backtested and optimized (no expert opinion) • Accounts for correlations of earthquake interactions • Probabilities can change rapidly in time
A New Data Driven Earthquake ForecastOperational Earthquake Forecasting • Natural Time Weibull (NTW) • ANSS global digital catalog data • Uses a standard probability model (Weibull) • Select best parameters based on backtesting • Accounts for correlations of earthquake interactions • Probabilities increase with: -Increases in small earthquake rate - Time since the last large earthquake • Probabilities of another large earthquake decrease just after the most recent event (but not to zero!)
Optimized 48 month Japan forecast: Probabilities (%) vs. Time for Magnitude ≥ 7.25 Japan EQ Forecast Advanced Technology (Open Hazards Group) Optimal forecasts via backtesting, using common validation and verification testing procedures. Forecast Date: 2012/03/16 • Scatter Plot • 1980-present • Observed Frequency vs. Computed Probability Temporal Receiver Operating Characteristic 1980-present
Earthquake Forecasts (Probability in %) for Eight Cities in Japan Probability of Magnitude ≥ 7 -- Within 4 Years from 3/16/2012 and Within 100 miles 13% 11% 27% 15% 28% Osaka 81 KM: 2.0% 161 KM: 3.4% 242 KM: 7.0% Nagoya 81 KM: 0.7% 161 KM: 3.2% 242 KM: 13.3% Kyoto 81 KM: 1.2% 161 KM: 3.5% 242 KM: 6.9% Niigata 81 KM: 1.6% 161 KM: 4.0% 242 KM: 9.7% Miyazaki 81 KM: 5.2% 161 KM: 10.1% 242 KM: 14.5% Nagasaki 81 KM: 1.2% 161 KM: 5.3% 242 KM: 9.8% Tokyo 81 KM: 1.0% 161 KM: 8.6% 242 KM: 22.6% Sendai 81 KM: 1.6% 161 KM: 9.2% 242 KM: 20.9% 10% 11% 27%
Japan 4 Cities Forecast Probability of M≥6.7, Within 12 Months, Distance ≤ 150 miles Blog posted July 30, 2010 Tokyo: 16% Osaka: 10% Niigata: 8% Sendai: 13%
M9.1 Great Tohoku Earthquake March 11, 2011 Movie produced on March 8, 2011 by W. Graves and J.R. Holliday Probability of M>6 Earthquake within 1 Year of Date
Great Tohoku Earthquake: Could it have been triggered by another earthquake? Trigger event may have been a M7.4 earthquake that occurred on December 21, 2010, 100 km east of the Ogasawara Islands, on the Izu-Bonin-Mariana trench (e.g., east of Iwo-Jima and Chichi-Jima, Japan
Izu-Bonin-Mariana Arc Forecast for the Next Year from 2012/01/06 Risk of another great earthquake and tsunami?
California EQ Forecast Advanced Technology (Open Hazards Group) Optimized 12 month California-Nevada forecast: Probabilities (%) vs. Time for Magnitude ≥ 6 Optimal forecasts via backtesting, using common validation and verification testing procedures. Forecast Date: 2012/03/15 • Scatter Plot • 1980-present • Observed Frequency vs. Computed Probability Hit Rate Temporal Receiver Operating Characteristic 1980-present False Alarm Rate
California Four Cities Forecast Probability of M ≥ 7, Distance ≤ 150 Miles, Within 12 Months 11% 12% 15% 16%
In Summary • Earthquake risk changes in real time • Tohoku earthquake may have been triggered by a M7.4 event 600 km away • Risk of an M7 earthquake in California is largest in southern California