Download
1 / 35
350 likes | 448 Views
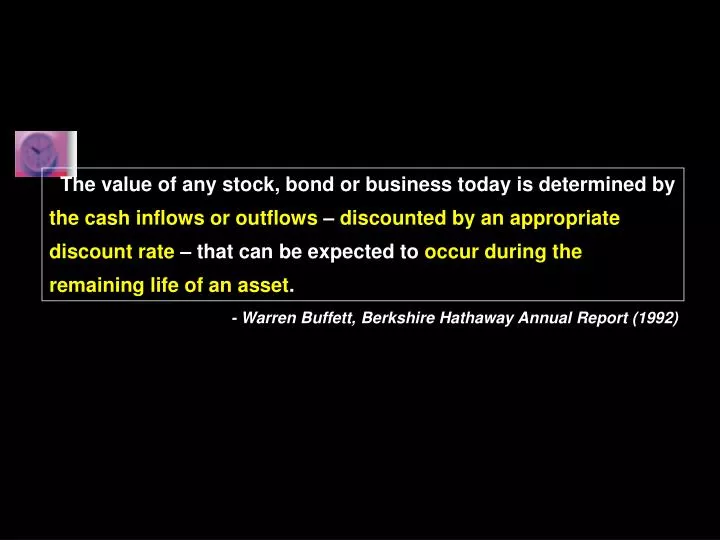
The value of any stock, bond or business today is determined by the cash inflows or outflows – discounted by an appropriate discount rate – that can be expected to occur during the remaining life of an asset. - Warren Buffett, Berkshire Hathaway Annual Report (1992).

E N D
The value of any stock, bond or business today is determined by the cash inflows or outflows – discounted by an appropriate discount rate – that can be expected to occur during the remaining life of an asset. - Warren Buffett, Berkshire Hathaway Annual Report (1992)
The Evolution of Value Based Management Basic Notion Firm value = PV (future free cash flows). Strategic Value Analysis LEK / Alcar Firm value = PV (FCF of existing assets)+ PV (Growth opportunities) EVA Stern Stewart & Co. Firm value = ΣPV t (EVA t ) + Invested Capital. CVA BCG and HOLT Value Associates Firm value = ΣPV t (CVA t ) + Invested Capital.
Net working capital (CA-CL) • 2. Capital expenditures and long-term assets. Free Cash Flow Approach Firm’s FCF = Financing or Investors’ cash flow Firm’s perspective Investor’s perspective EBITDA – cash tax payments – incremental investment in operating assets FCF = The amount received by investors interest payment to creditors + repayment of debt principal - additional debt issued + dividends + share repurchases - additional stock issued Financing cash flow
Free Cash Flow& Firm valuation Value of Non-operating assets Firm Value Present value of free cash flow = + - Marketable securities - Excess real state - Over funded pension plan Firm Value = Future claim + Shareholder value - Interest-bearing debt - Capital lease obligations - Under funded pension plan - Contingent liabilities
Through value drivers, we can analyze how to improve to firm’s FCF. Free Cash Flow Approach Free cash flow and firm’s valuation • How long should we calculate? • CF during strategic planning period • After strategic planning period, “residual value” • How long is strategic planning period? • 2. How to forecast free cash flow? (Value drivers) • Assumption of “Value Drivers” • a) Sales growth • b) Operating profit margin • c) Cash tax rate • d) Net working capital / sales • e) Other long-term assets / sales • Determine the discount rate. • - Based on opportunity cost.
Forecasting Free Cash Flow Case: Ashley Corporation Value driver assumptions Residual period begins
Free Cash Flow Calculations Sales of prior year=$240,000 Year 1 =(1+Sales growth rate) × Prior year sales = ( 1+0.08) ×$240,000=259,200 Incremental asset investment in year t = ( Sales in year t – Sales in year t-1) × Asset-to-sales percent Year1 Net working capital=($259,200-$240,000) ×5.5%=$1,056 Fixed assets=($259,200-$240,000) ×40%=$7,680 Other long term assets= =($259,200-$240,000) ×2%=$384
Determining the Discount Rate Weighted cost of capital 【Cost of debt×(1-Tax rate) ×Debt/Firm Value】 7.68%×(1-0.27)=5.61% +【Cost of equity × Equity/Firm value】 risk free rate+ company beta × market premium 6%+(1.35×8%)=16.8% Percentage of capital After-Tax Cost Weighted Cost Debt 25% 5.61% 1.40% Equity 75% 16.80% 12.60% WACC 14.00%
Free Cash Flow Calculations Planning period present value Residual value in year T Residual value in year 10=$18,623/(0.14-0.026)=$163,36 Present value of residual CF=$163,36/(1+0.14)10=$44.06
Firm’s Economic value Economic value=present value of all cash flows = Present value of the planning period free cash flow +Present value of the residual period free cash flow Present value of the cash flows for year1-10 $ 38.52 Present value of the cash flows for the residual value $ 44.06 Firm’s economic value $82.58 Excess real estate 7.5 Firm value $ 90.08 Debt $ 42.00 Shareholder value $48.08
Magic Value Drivers Sales growth increase Firm value increase Threshold profit margin=7.2% Sales growth increase Firm value decrease Myth of Growth & Firm Value In Case Table 4.2 PV of cash flow=$82.6 million If sales growth =0 PV of cash flow=$87.6 million Potential value = negative 5 million Firm value = PV (FCF of existing assets)+ PV (Growth opportunities)
Further Dissuasion of Value Driver Operating Profit Margin Equity Value Change in Base case of EV Base case sensitivity Analysis of operating margin Thousands of dollars Through sensitivity Analysis of different Value Divers We can find the one affects firm’s value most !
Economic Value Road Map Operating Decision Investing Decision Financing Decision
EVA is based on something we have know for a long time: what we call profit, the money left to service equity, is not profit at all. Until a business returns a profit that is greater than its cost of capital, it operates at a loss. Never mind that it pays taxes as if it had a genuine profit. The enterprise still returns less to the economy than it devours in resources…. Until then it does not create wealth; it destroys it. - Peter Drucker, The Information Executives Truly Need (1995)
Cost of goods sold Accounting profits Operating expenses Interest expense = - - - - Sales Taxes Charge for all capital used Cost of goods sold Operating expenses Economic profits or Residual income - = - Taxes - Sales - NOPAT Net operating profits after taxes EVA Approach Accounting profits v.s. Economic profits
Free Cash flow & Residual Income Approach Firm Value Present value of future free cash flow = Invested Capital Present value of future residual Income = +
Free Cash flow & Residual Income Approach g=7.5% g=7.5% 1. Profit margin = 6.25% 2. Retention ratio = 60% 3. Investment (WC & real) = 0.5 per dollar of sales growth 4. Cost of capital = 10%
Free Cash flow & Residual Income Approach g=7.5% g=7.5% Residual Income: 1,250-10,000 × 10% = 250
Free cash flow or Residual Income? The weakness of free cash flow: • Doesn’t provide readily apparent measure of • Annual Operating performance • When Free cash flow < 0 • Investment is high in profitable firm • Operating is poor in unprofitable firm • e.g.Wal-Mart FCF -13% of capital, R is +8 % above its cost of capital • Kmart FCF +7% of capital, R is -3 % below its cost of capital Residual Income provides better measure of period performance!
EVA Approach Cash flow from operations After-tax interest Capital charges Accounting adjustments EVA = + + - + Accruals Earnings Operation profits Economic profits Economic Value Added (EVA)
EVA Drivers • EVA = NOPAT- (k*Capital) = (r- k)*capital • NOPAT = operating profits after taxes but before financing costs and noncash bookkeeping entries except depreciation • Return on capital (r) = • Return on capital = • NOPBT = firm’s net operating profits before taxes Capital Turnover Cash tax rate Profit Margin
EVA Calculation Convert NOPAT and Capital form accounting book value to economic book value 1.Convert from accrual to cash accounting (LIFO, Bad debt reserves) 2.Capitalize market-building expenditures that have been expensed in the past (R&D) 3.Remove cumulative unusual losses or gains after taxes
Example: Hobbs-Meyer co Finance Equity Equivalents Tax Equity Equivalents
Example :Hobbs-Meyer Co. • 法一 EVA=NOPAT-Cost of capital* Capital =686000-10%*3984000=288000 • 法二 EVA=(Return on capital-Cost of capital) *Capital =(686000/3984000-10%)*3984000 =288000
EVA V.S MVA Market Value Added = Market Value of Equity - Book Value of Equity = Present value of all future EVA Market Value of Equity =Book Value of Equity + Present value of all future EVA
EVA V.S MVA Positive MVA Negative MVA
EVA VS Investment 相 反 Source: Stern Stewart Research “Special Report”,Apr,2002
Advantages of EVA • EVA is closely related to NPV. • It avoids the problems associates with approaches that focus on percentage spreads( rate of return- rate of cost) • It makes top managers responsible for a measure that they have more control over • It is influenced by all of the decisions that managers have to make within a firm
Side Effectsof EVA with minimize risk • increases in current EVA come at the expense of future EVA • higher EVA is accompanied by an increase in the cost of capital • increase in EVA is less than what the market expected it to be, leading to a drop in the market price